
Fig. 4
- ID
- ZDB-FIG-250808-54
- Publication
- Wu et al., 2025 - Pu.1/Spi1 dosage controls the turnover and maintenance of microglia in zebrafish and mammals
- Other Figures
-
- Fig. 1
- Fig. 2
- Fig. 2 - Supplemental 1
- Fig. 3
- Fig. 3 - Supplemental 1
- Fig. 3 - Supplemental 2
- Fig. 3 - Supplemental 3
- Fig. 3 - Supplemental 4
- Fig. 3 - Supplemental 5
- Fig. 3 - Supplemental 6
- Fig. 4
- Fig. 5
- Fig. 5 - Supplemental 1
- Fig. 5 - Supplemental 2
- Fig. 5 - Supplemental 3
- Fig. 6
- Fig. 6 - Supplemental 1
- All Figure Page
- Back to All Figure Page
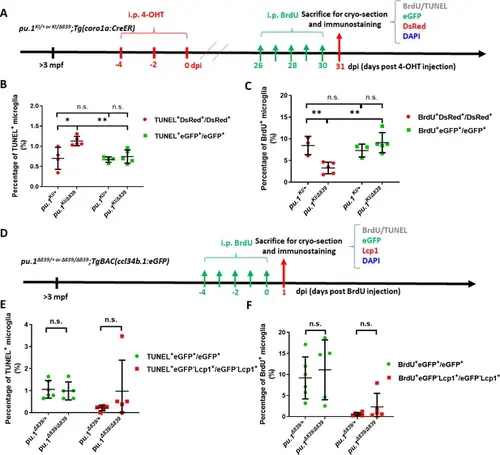
pu.1-deficient microglia in mosaic condition were eliminated by cell competition. (A) The experimental setup for BrdU incorporation and TUNEL assays in adult pu.1KI/+;Tg(coro1a:CreER) and pu.1KI/Δ839;Tg(coro1a:CreER) fish at 1 mpi. (B) Quantification of the percentage of TUNEL+ cells in eGFP+ and DsRed+ microglia in pu.1KI/+;Tg(coro1a:CreER) (n=4) and pu.1KI/Δ839;Tg(coro1a:CreER) (n=5) fish at 1 mpi. (C) Quantification of the percentage of BrdU+ cells in eGFP+ and DsRed+ microglia in adult pu.1KI/+;Tg(coro1a:CreER) (n=4) and pu.1KI/Δ839;Tg(coro1a:CreER) fish at 1 mpi. (D) The experimental setup for BrdU incorporation and TUNEL assays in adult pu.1Δ839/+;TgBAC(ccl34b.1:eGFP) and pu.1Δ839/Δ839;TgBAC(ccl34b.1:eGFP) fish. (E) Quantification of the percentage of TUNEL+eGFP+ microglia in adult pu.1Δ839/+;TgBAC(ccl34b.1:eGFP) and pu.1Δ839/Δ839;TgBAC(ccl34b.1:eGFP) fish. (F) Quantification of the percentage of BrdU+eGFP+ microglia in adult pu.1Δ839/+;TgBAC(ccl34b.1:eGFP) (n=6) and pu.1Δ839/Δ839;TgBAC(ccl34b.1:eGFP) (n=5) fish. n.s.=not significant, p>0.05; *p<0.05; **p<0.01. |