
Fig. 1
- ID
- ZDB-FIG-250808-44
- Publication
- Wu et al., 2025 - Pu.1/Spi1 dosage controls the turnover and maintenance of microglia in zebrafish and mammals
- Other Figures
-
- Fig. 1
- Fig. 2
- Fig. 2 - Supplemental 1
- Fig. 3
- Fig. 3 - Supplemental 1
- Fig. 3 - Supplemental 2
- Fig. 3 - Supplemental 3
- Fig. 3 - Supplemental 4
- Fig. 3 - Supplemental 5
- Fig. 3 - Supplemental 6
- Fig. 4
- Fig. 5
- Fig. 5 - Supplemental 1
- Fig. 5 - Supplemental 2
- Fig. 5 - Supplemental 3
- Fig. 6
- Fig. 6 - Supplemental 1
- All Figure Page
- Back to All Figure Page
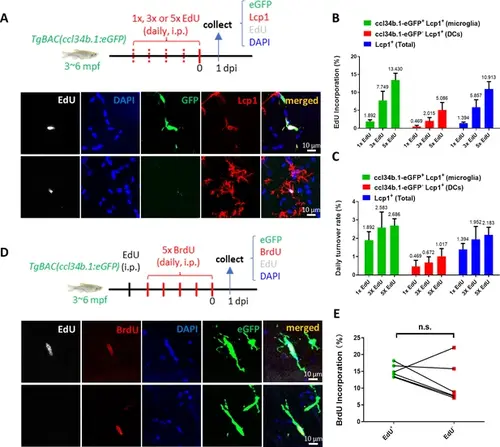
Adult microglia in zebrafish undergo rapid turnover and random proliferation to replenish and maintain their pool. (A) Schematic diagram shows the workflow of EdU pulse experiment in adult TgBAC(ccl34b.1:eGFP) zebrafish and the representative images of proliferating microglia (ccl34b.1-eGFP+ Lcp1+EdU+) and dendritic cells (DCs) (ccl34b.1-eGFP-Lcp1+EdU+) in the midbrain. (B) Quantification of the EdU incorporation proportions in microglia and dendritic cells (DCs) with different dosages of EdU pulses. (n=4 for each group) (C) The daily turnover rate of microglia and DCs was calculated by dividing the EdU incorporation rate with EdU pulses. (D) Schematic diagram shows the experimental setup for EdU-BrdU double-pulse in adult wild-type fish and the representative images show two BrdU+ microglia with or without EdU incorporation. (E) Comparison of BrdU incorporation proportions in EdU+eGFP+ and EdU-eGFP+ microglia (n=6). n.s.=not significant, p>0.05. |