|
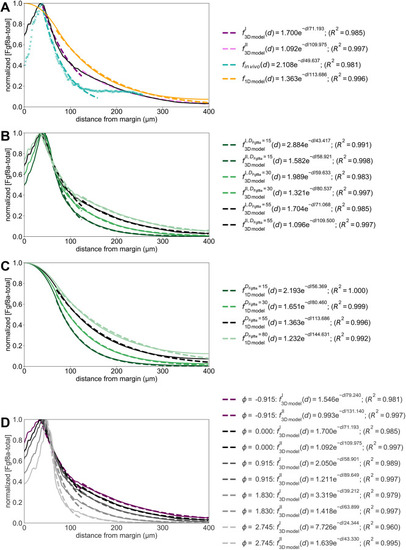
Fitting exponential decay to in vivo and simulated gradients. (A) Exponential decay fit to in vivo 1D and 3D model gradients (dashed lines, see key). The in vivo gradient was best fitted in the range 40 μm≤d≤161 μm. For the 1D model, the source region was excluded from the fit, i.e. d≥70 μm. The gradient of the 3D model was best fitted by a mixture of two exponential functions: the first for 35 μm≤d≤125 μm and the second for d>125 μm. (B) Fit to image-based 3D simulation gradients for different Fgf8a diffusion coefficients. (C) Exponential decay fit to 1D model simulation gradients for different Fgf8a diffusion coefficients. (D) Exponential fit to gradients of different ECS tube thicknesses. All curves were fitted using the non-linear least squares function curve_fit from the scipy.optimize library (Virtanen et al., 2020). The key provides the fitted proportionality coefficients and their goodness of fit R2.
|