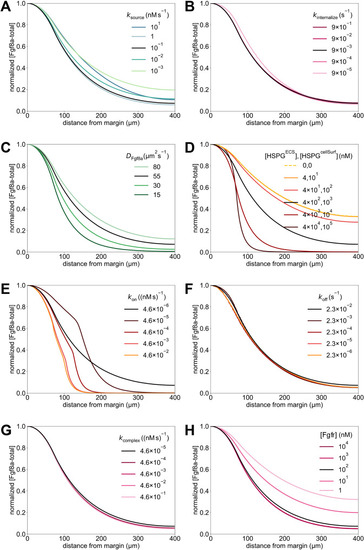
Sensitivity of a 1D model to variations in the model parameters. (A,B,G) Similar to the 3D model, the normalized simulated gradient shows robustness against changes in rates of source (A) and sink [i.e. kinternalize (B) and kcomplex (G)] (see key). (C,D) Changes in the effective diffusivity, by changing either the molecular diffusion coefficient of Fgf8a (C) or HSPG concentrations (D), strongly affect the gradient. The stronger the HSPG binding and the smaller the diffusion coefficient, the steeper and shorter the gradient. (E,F) Higher HSPG affinities (E) lead to shorter and steeper gradients with higher amplitude at the source (see absolute concentrations in Fig. S7E), whereas reducing HSPG unbinding rates (F) does not affect the gradient shape. (H) Compared to the baseline, decreasing [Fgfr] leads to flatter gradients, whereas increasing [Fgfr] has almost no effect on the gradient. This could be because of the HSPG binding that precedes Fgfr binding in our model, which could be the limiting step. For the baseline gradients, shown as a solid black line in all panels, the same parameters were used as in the 3D model (Table 2). All profiles are normalized by their respective maximum concentration. Profiles are shown at , which for complex internalization rates 100 times smaller and all HSPG binding rates larger than the baseline is before the gradient has reached steady state. This agrees with previous analytical solutions showing that steady state is reached slower for higher non-receptor binding (Lander et al., 2007) and smaller degradation rates (Berezhkovskii et al., 2010; Gordon et al., 2013).
|
