|
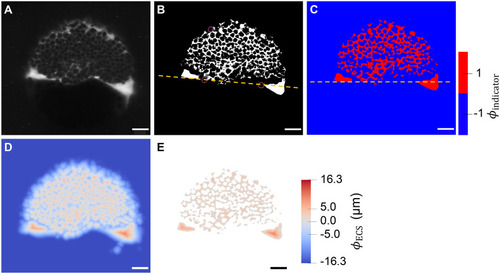
Steps for modeling ECS geometries from light-sheet microscopy volumes. Volumes are visualized for an exemplary time point (12 out of 25, ≈60% epiboly) and z-slice (plane 480 from the epiblast in the direction of hypoblast and the yolk, i.e. the mid-plane formed by the AV/DV axes). (A) TMR-dextran channel of the light-sheet data after 3D multi-view fusion; fluorescence marks the ECS. (B) Segmentation mask of the ECS (white) with a yellow dashed line showing the margin plane and pink circles highlighting specks of noise and small unconnected islands that were subsequently removed. (C) Binary indicator function of the ECS after mask denoising and horizontal alignment of the margin plane (yellow dashed line). (D) Re-distanced signed-distance function, φECS, of the level-set representation of the ECS surface. (E) Sparse block grid storing only points in the ECS. Scale bars: 50 μm.
|