|
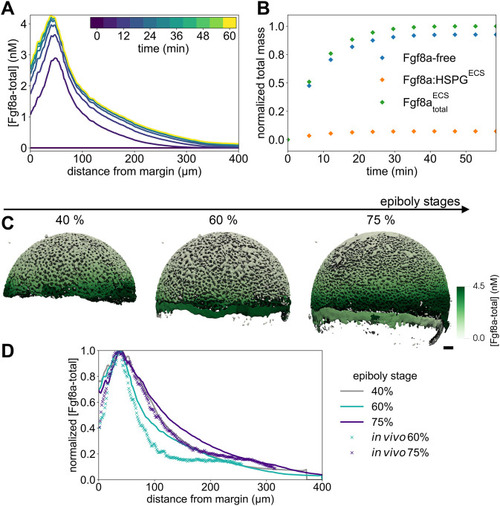
A SDD+HSPG mechanism is sufficient to explain the formation of the Fgf8a gradient in realistic ECS geometries. All Fgf8a concentrations in the simulation were initially set to zero throughout the embryo. (A) Evolution of the emerging AV gradient profile of (Fgf8a - total) over time (colored bar). The gradient reaches a steady state at ≈30 min. (B) The Fgf8a-free/Fgf8a:HSPGECS ratio remains almost constant (92.6%/7.4%) and close to the experimentally measured values (93%/7%) throughout the 60 min of simulated time. (C) Visualization of the simulated Fgf8a-total concentrations in the ECS geometries at 40%, 60% and 75% epiboly. (D) Simulated (lines) and experimentally measured (symbols) AV profiles at different stages (see key). Experimental profiles were only available at 60% and 75% epiboly, and show the mean over N = 15 embryos. Simulated profiles are computed at . Scale bar: 50 μm.
|