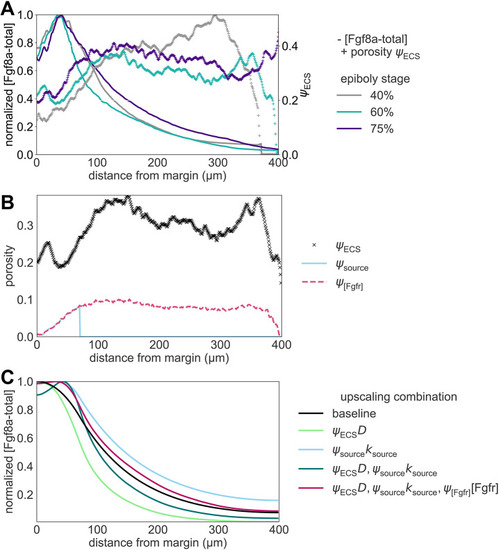
Using porosity profiles along the AV axis for upscaling in a 1D model. (A) Comparison of the ECS porosity (plus symbols, right y-axis) and [Fgf8a-total] profiles (lines, left y-axis) along the AV axis at different stages of epiboly (see key). In the first 100 μm from the margin, where the profile has a kink, ψECS approximately doubles. All profiles are computed at . (B) AV profiles of the ECS porosity, ψECS (black symbols); the source, ψsource (solid light-blue line); and the sink, ψ[Fgfr] (dashed pink line). All profiles are computed according to Eqn 15 by dividing the volume of the respective phase of interest by the total volume of the embedding spherical shell. (C) Upscaling SDD in porous ECS geometries. To disentangle the role of porous ECS heterogeneity in source, diffusion and sink on the formation of the AV gradient kink, we accounted for the AV profiles of ψECS, ψsource and ψ[Fgfr] by linearly scaling (1) DFgf8a and with ψECS (light-green line) and (2) fsource with ψsource (light-blue line), and by (3) combining (1) and (2) (dark-green line), and (4) combining (3) with scaling [Fgfr] with ψ[Fgfr] (pink line). The kink at the source is partly recovered when upscaling DFgf8a and fsource (case 3, dark-green line). All profiles are normalized by their maximum concentration and shown at .
|
