|
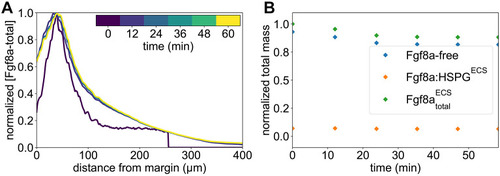
Simulated Fgf8a gradient using optimized parameters with experimental profile as initial condition. For parameters, see Table 2. (A) Normalized AV concentration profiles of Fgf8a-total at different simulated times (see color intensity bar). All profiles are normalized by their respective maximum xz-plane-averaged concentration. The experimental profile used as the initial condition is shown in dark purple (time 0). Simulated profiles reach a steady state within 12 min. (B) Normalized total mass of two Fgf8a fractions, Fgf8a:HSPGECS and Fgf8a-free, along with their sum (Fgf8a-total). This set of parameters maintains a constant total Fgf8a mass and preserves the in vivo Fgf8a/Fgf8a:HSPGECS ratio of 93%/7%.
|