|
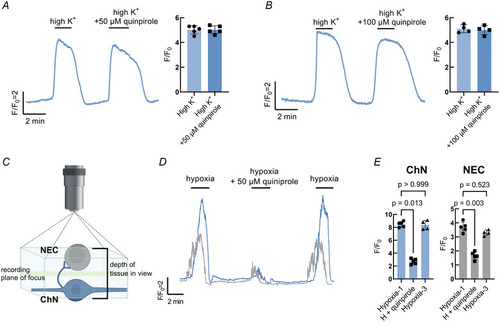
Postsynaptic modulation of the hypoxic response by presynaptic D2R activation A, calcium imaging trace from a single chain neuron with summary data showing no change in the response to high K+ with the addition of 50 µm quinpirole. B, calcium imaging trace from a single chain neuron (ChN) with summary data showing no change in the response to high K+ with the addition of 100 µm quinpirole. C, schematic illustration of preparation for dual recording of neuroepithelial cell (NEC) and ChN. Focus plane for recording was set at a tissue depth between both cells (green line) where both cells were still in view (blue box). D, dual‐recording Ca2+ imaging trace of a NEC (grey) and ChN (blue) recorded simultaneously. E, summary data treated as in (D) showing a decrease in the hypoxic signal produced by ChNs (Kruskal–Wallis test, P = 0.013, n = 5 cells) and NECs (Kruskal–Wallis test, P = 0.003, n = 5 cells) with quinpirole. In both ChNs and NECs, the hypoxic response was fully recovered after quinpirole treatment (P > 0.999 or P = 0.523, n = 4 cells). The schematic in (C) was created with BioRender.com. [Colour figure can be viewed at wileyonlinelibrary.com]
|