|
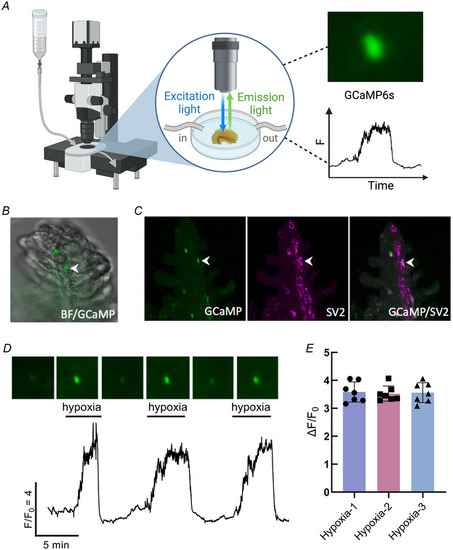
Hypoxia induced intracellular Ca2+ responses in gill neuroepithelial cells from Tg(elavl3:GCaMP6s) zebrafish A, schematic of the GCaMP recording preparation illustrating a fluorescence microscope (left), an isolated gill in a recording chamber fitted with in‐ and out‐flow for superfusion (centre) and fluorescence excitation in a cell during a hypoxic stimulus (right). B, overlay of brightfield and green fluorescence (488 nm) images of a GCaMP‐positive neuroepithelial cell (NEC, arrowhead) in situ containing GCaMP from a Tg(elavl3:GCaMP6s) zebrafish. C, post hoc confocal imaging confirming immunohistochemical co‐localization of GCaMP (green) with synaptic vesicle protein‐2 (SV2, magenta) in the NEC (arrowheads) identified in (B). Left: GCaMP and SV2 separately, and GCaMP and SV2 labelling together. D, Ca2+ imaging trace from the GCaMP‐containing cell in (A) during three bouts of hypoxia. Scale indicates time (min) and relative changes in fluorescence (F/F0) corresponding to changes in intracellular Ca2+ concentration ([Ca2+]i). Time‐series micrographs above show fluorescence changes over time. E, mean ± SD F/F0 in NECs in response to three consecutive bouts of hypoxia. There was no significant change in the magnitude of the Ca2+ response to hypoxia over time (Kruskal–Wallis test, P > 0.999, n = 7 cells). The schematic in (A) was created with BioRender.com. [Colour figure can be viewed at wileyonlinelibrary.com]
|