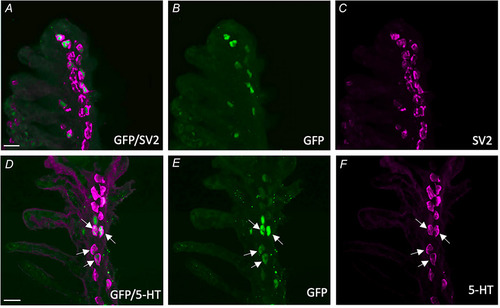
Characterization of GCaMP‐positive neuroepithelial cells (NECs) in the gill epithelium of transgenic elavl3:GCaMP6s zebrafish

Confocal imaging of immunohistochemical localization of GCaMP with NECs containing synaptic vesicle protein‐2 (SV2) and 5‐hydroxytryptamine (5‐HT). A, labelling with GFP (green) co‐localized with NECs containing SV2 (magenta). B and C, GCaMP and SV2 labelling shown separately. Scale bar = 20 µm in (A) to (C). D, labelling with GCaMP (green) co‐localized with NECs containing 5‐HT (magenta, arrows). E and F, GCaMP and 5‐HT labelling shown separately. Scale bar = 20 in (D) to (F). [Colour figure can be viewed at wileyonlinelibrary.com]

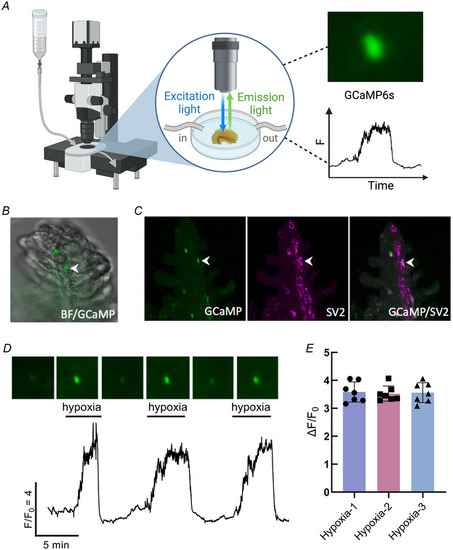
Hypoxia induced intracellular Ca2+ responses in gill neuroepithelial cells from Tg(elavl3:GCaMP6s) zebrafish

A, schematic of the GCaMP recording preparation illustrating a fluorescence microscope (left), an isolated gill in a recording chamber fitted with in‐ and out‐flow for superfusion (centre) and fluorescence excitation in a cell during a hypoxic stimulus (right). B, overlay of brightfield and green fluorescence (488 nm) images of a GCaMP‐positive neuroepithelial cell (NEC, arrowhead) in situ containing GCaMP from a Tg(elavl3:GCaMP6s) zebrafish. C, post hoc confocal imaging confirming immunohistochemical co‐localization of GCaMP (green) with synaptic vesicle protein‐2 (SV2, magenta) in the NEC (arrowheads) identified in (B). Left: GCaMP and SV2 separately, and GCaMP and SV2 labelling together. D, Ca2+ imaging trace from the GCaMP‐containing cell in (A) during three bouts of hypoxia. Scale indicates time (min) and relative changes in fluorescence (F/F0) corresponding to changes in intracellular Ca2+ concentration ([Ca2+]i). Time‐series micrographs above show fluorescence changes over time. E, mean ± SD F/F0 in NECs in response to three consecutive bouts of hypoxia. There was no significant change in the magnitude of the Ca2+ response to hypoxia over time (Kruskal–Wallis test, P > 0.999, n = 7 cells). The schematic in (A) was created with BioRender.com. [Colour figure can be viewed at wileyonlinelibrary.com]

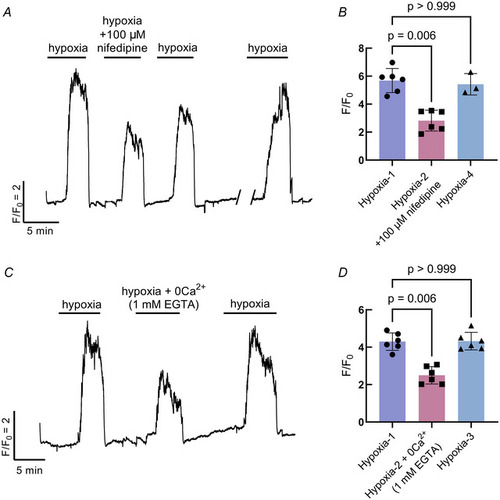
Extracellular Ca2+ contributes to the response to hypoxia in neuroepithelial cells (NECs)

A, Ca2+ imaging trace from a GCaMP‐containing NEC, where the response to hypoxia was reduced with the addition of 100 µm nifedipine, an L‐type Ca2+ channel blocker. The response to hypoxia was fully recovered after a 15 min washout (break in trace). B, Summary data from NECs treated as in (A) illustrating a reduction in the mean ± SD F/F0 (Kruskal–Wallis test, P = 0.006, n = 6 cells). Three cells were evaluated for recovery after a 15 min washout period (Kruskal–Wallis test, P > 0.999, n = 3 cells). C, Ca2+ imaging trace from a GCaMP‐containing NEC, where the response to hypoxia was reversibly reduced when Ca2+ was removed from the extracellular solution. D, summary data from NECs treated as in (C) showing a reduction in the mean ± SD F/F0 (Kruskal–Wallis test, P < 0.006, n = 6 cells). The response to hypoxia fully recovered after zero Ca2+ treatment (Kruskal–Wallis test, P > 0.999). [Colour figure can be viewed at wileyonlinelibrary.com]

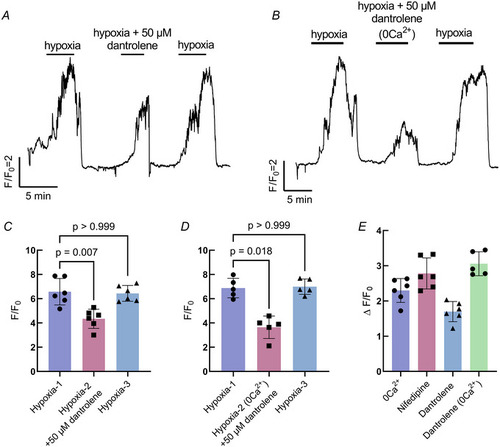
Intracellular Ca2+ contributes to the response to hypoxia in neuroepithelial cells (NECs)

A, Ca2+ imaging trace from a GCaMP‐containing NEC, where the response to hypoxia was reversibly reduced with the addition of 50 µm dantrolene, an inhibitor of intracellular Ca2+ release. B, Ca2+ imaging trace from a GCaMP‐containing NEC demonstrating the combined contributions of intracellular and extracellular Ca2+. The response to hypoxia was further reduced with the addition of 50 µm dantrolene in Ca2+‐free extracellular solution. C, summary data treated as in (A) showing reduction in the mean ± SD F/F0 (Kruskal–Wallis test, P = 0.007, n = 6 cells). The response to hypoxia fully recovered (Kruskal–Wallis test, P > 0.999, n = 6 cells). D, summary data treated as in (B) showing a reduction in the mean ± SD F/F0 (Kruskal–Wallis test, P < 0.008, n = 5 cells). The response to hypoxia fully recovered (Kruskal–Wallis test, P > 0.999, n = 5 cells). E, summary comparing all Ca2+ blocking treatments. The combination of dantrolene with Ca2+‐free extracellular solution resulted in an additive effect compared to dantrolene alone. [Colour figure can be viewed at wileyonlinelibrary.com]

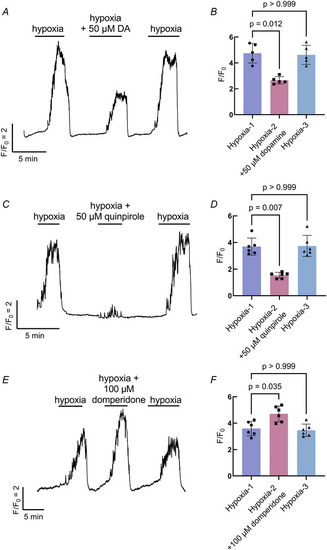
The effects of D2R activity on the neuroepithelial cell (NEC) response to hypoxia

Showing the effects of dopamine (A and B), quinpirole (C and D) and domperidone (E and F). A, Ca2+ imaging trace from a GCaMP‐containing NEC where the response to hypoxia was reversibly reduced with the addition of 50 µm dopamine (DA). C, Ca2+ imaging trace from a GCaMP‐containing NEC where the response to hypoxia was reversibly reduced with the addition of 50 µm quinpirole, a specific dopamine D2R agonist. E, Ca2+ imaging trace from a GCaMP‐containing NEC where the response to hypoxia was enhanced with the addition of 100 µm domperidone, a specific dopamine D2R antagonist. B, D and F, summary data showing the mean ± SD. F/F0 corresponding to experiments in (A), (C) and (E). Addition of 50 µm dopamine significantly reduced the Ca2+ response to hypoxia (Kruskal–Wallis test, P = 0.012, n = 5 cells) (B), as well as 50 µm quinpirole (Kruskal–Wallis test, P = 0.007, n = 6 cells) (D), wheras domperidone increased the mean ± SD F/F0 (Kruskal–Wallis test, P = 0.035, n = 6 cells) (F). The response to hypoxia fully recovered following all treatments (Kruskal–Wallis test, P > 0.999, n = 5–6 cells). [Colour figure can be viewed at wileyonlinelibrary.com]

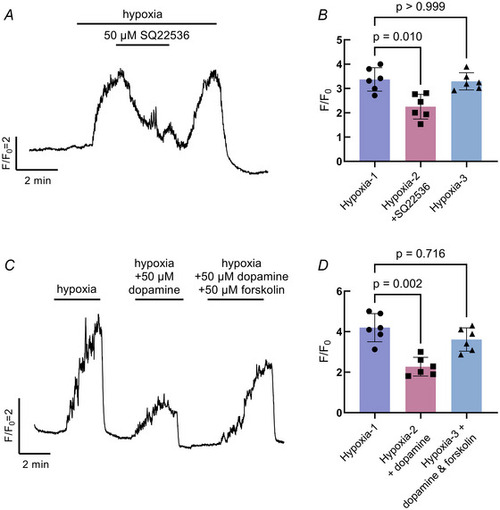
Dopamine acts through intracellular secondary messenger cAMP in neuroepithelial cells (NECs)

A, addition of SQ22536, an adenylyl cyclase (AC) inhibitor, decreased the effect of hypoxia on intracellular Ca2+. B, summary data treated as in (A) showing the mean ± SD F/F0 during the first 2 min of hypoxia exposure (Hypoxia‐1), the reduction in the mean ± SD F/F0 during the entire duration of SQ22536 exposure (Hypoxia‐2 + SQ22536; Kruskal–Wallis test, P = 0.010, n = 6 cells) and the mean ± SD F/F0 during the last 2 min of hypoxia exposure (Hypoxia‐3). C, forskolin, an AC activator, partially recovered the suppressive effect of dopamine on the Ca2+ response to hypoxia. D, summary data treated as in (C) showing recovery in the mean ± SD F/F0 of the hypoxic response from dopamine with forskolin (Kruskal–Wallis test, P = 0.002, n = 6 cells). The response to hypoxia fully recovered following both treatments (Kruskal–Wallis test, P > 0.999, n = 6 cells). [Colour figure can be viewed at wileyonlinelibrary.com]

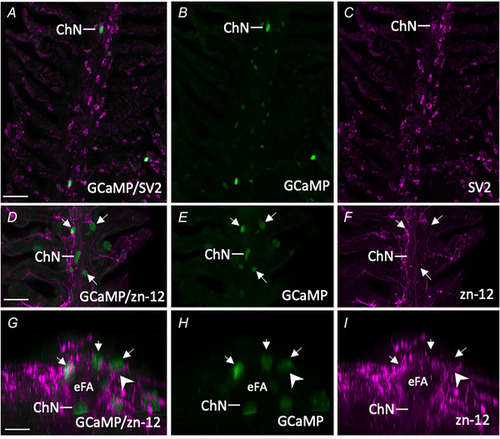
Characterization of GCaMP‐positive postsynaptic chain neurons (ChNs) in Tg(elavl3:GCaMP6s) zebrafish gills

AC, confocal imaging of immunohistochemical localization of GCaMP in a ChN containing synaptic vesicle protein‐2 (SV2, magenta). B and C, GCaMP and SV2 labelling shown separately. Scale bar = 50 µm in (A) to (C). DF, co‐labelling of GCaMP‐positive ChNs and NECs (green, arrows) with nerve fibres labelled with zn‐12 (magenta). E and F, GCaMP and zn‐12 labelling shown separately. Scale bar = 50 µm in (D) to (F). GI, images from (D) to (F), cropped and titled back 90°. Rotation demonstrates neural connection (arrowhead) between nerve fibres located below the efferent filament artery (eFA) where ChNs are located, projecting to GCaMP‐positive NECs. [Colour figure can be viewed at wileyonlinelibrary.com]

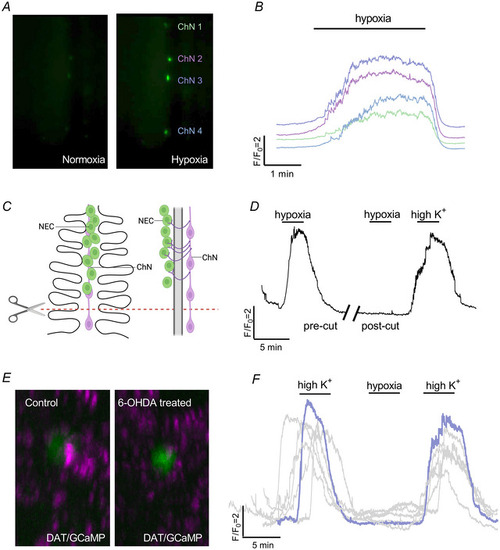
The chain neuron (ChN) calcium response to hypoxia requires synaptic contact with neuroepithelial cells (NECs)

A, examples from live fluorescence imaging at 488 nm of four ChNs along a single filament in normoxia (left micrograph) and hypoxia (right micrograph). B, calcium traces from the four ChNs shown in (A) responding to hypoxia. Different colours represent corresponding cells (ChN 1–4) in (A). C, schematic of a gill filament (left) and rotation by 90° on the y‐axis (right) illustrate filament transection. Filaments were cut along the red dashed line at the proximal end where a ChN was present, but no NECs were observable. D, calcium imaging trace of a single ChN before and after filament transection. After the filament was cut (break in trace), the neuron no longer responded to hypoxia (n = 5 cells). As a positive control, viability of the neuron was demonstrated by stimulation with a solution of high extracellular K+. E, confocal imaging of gills from a double transgenic animal produced by crossing Tg(elavl3:GCaMP6s) and Tg(dat:tom20 MLS‐mCherry) fish showing the relationship between the dopamine active transporter (DAT) nerve endings (magenta) and GCaMP‐positive NECs (green) in control (left micrograph) and 6‐OHDA‐treated gills (right micrograph). DAT labelling was found in close proximity to NECs but was reduced after 6‐OHDA treatment. F, overlayed Ca2+ imaging traces from 6‐OHDA treated animals. After 6‐OHDA treatment, the ChNs did not respond to hypoxia (n = 6 cells). Response to high extracellular K+ confirmed cell viability. The schematic in (C) was created with BioRender.com. [Colour figure can be viewed at wileyonlinelibrary.com]

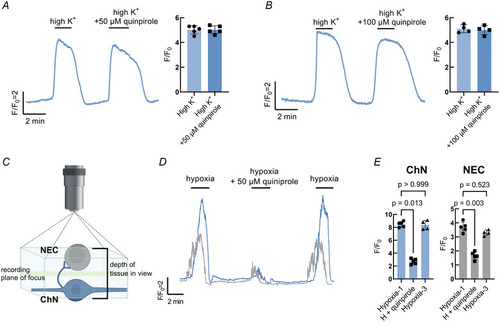
Postsynaptic modulation of the hypoxic response by presynaptic D2R activation

A, calcium imaging trace from a single chain neuron with summary data showing no change in the response to high K+ with the addition of 50 µm quinpirole. B, calcium imaging trace from a single chain neuron (ChN) with summary data showing no change in the response to high K+ with the addition of 100 µm quinpirole. C, schematic illustration of preparation for dual recording of neuroepithelial cell (NEC) and ChN. Focus plane for recording was set at a tissue depth between both cells (green line) where both cells were still in view (blue box). D, dual‐recording Ca2+ imaging trace of a NEC (grey) and ChN (blue) recorded simultaneously. E, summary data treated as in (D) showing a decrease in the hypoxic signal produced by ChNs (Kruskal–Wallis test, P = 0.013, n = 5 cells) and NECs (Kruskal–Wallis test, P = 0.003, n = 5 cells) with quinpirole. In both ChNs and NECs, the hypoxic response was fully recovered after quinpirole treatment (P > 0.999 or P = 0.523, n = 4 cells). The schematic in (C) was created with BioRender.com. [Colour figure can be viewed at wileyonlinelibrary.com]

Acknowledgments
This image is the copyrighted work of the attributed author or publisher, and ZFIN has permission only to display this image to its users. Additional permissions should be obtained from the applicable author or publisher of the image. Full text @ J. Physiol.