IMAGE

Figure 9

ID
ZDB-IMAGE-250423-77
Source
Figures for Reed et al., 2025
Image
Figure Caption

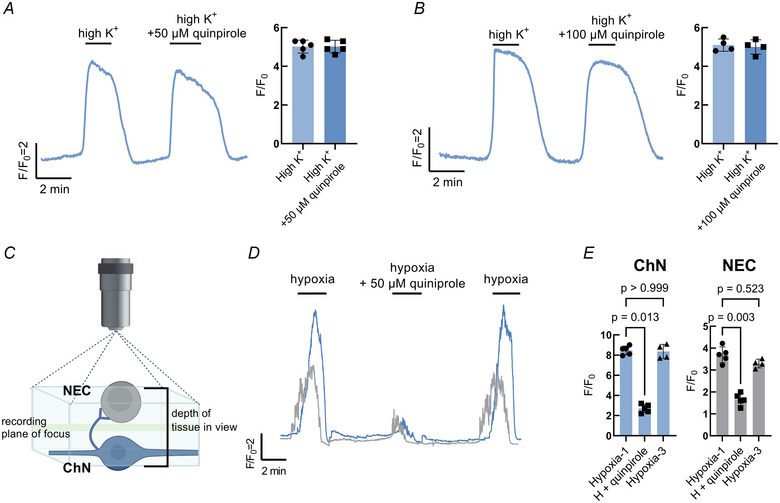
Figure 9 Postsynaptic modulation of the hypoxic response by presynaptic D2R activation

A, calcium imaging trace from a single chain neuron with summary data showing no change in the response to high K+ with the addition of 50 µm quinpirole. B, calcium imaging trace from a single chain neuron (ChN) with summary data showing no change in the response to high K+ with the addition of 100 µm quinpirole. C, schematic illustration of preparation for dual recording of neuroepithelial cell (NEC) and ChN. Focus plane for recording was set at a tissue depth between both cells (green line) where both cells were still in view (blue box). D, dual‐recording Ca2+ imaging trace of a NEC (grey) and ChN (blue) recorded simultaneously. E, summary data treated as in (D) showing a decrease in the hypoxic signal produced by ChNs (Kruskal–Wallis test, P = 0.013, n = 5 cells) and NECs (Kruskal–Wallis test, P = 0.003, n = 5 cells) with quinpirole. In both ChNs and NECs, the hypoxic response was fully recovered after quinpirole treatment (P > 0.999 or P = 0.523, n = 4 cells). The schematic in (C) was created with BioRender.com. [Colour figure can be viewed at wileyonlinelibrary.com]

Acknowledgments
This image is the copyrighted work of the attributed author or publisher, and ZFIN has permission only to display this image to its users. Additional permissions should be obtained from the applicable author or publisher of the image. Full text @ J. Physiol.