
Fig. 6 - Supplemental 1
- ID
- ZDB-FIG-250214-79
- Publication
- Meissner-Bernard et al., 2025 - Geometry and dynamics of representations in a precisely balanced memory network related to olfactory cortex
- Other Figures
- All Figure Page
- Back to All Figure Page
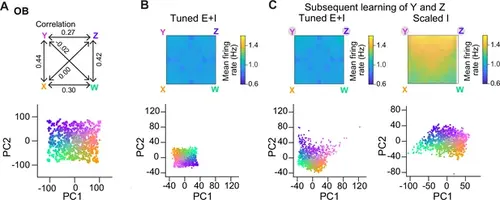
Further analyses of pattern distances: correlated odors. (A–C) Pattern distances in Tuned E+I networks with (right) and without (left) two additional assemblies representing Y and Z (see Figure 6) based on 80 E neurons drawn from assemblies. Similar analysis as in Figure 5—figure supplement 1, but for the odor subspace described in Figure 6. (A) dE. (B) dE^ . (C) dM. (D) Pattern classification probability quantified by quadratic discriminant analysis (QDA). PTarget quantifies the probability that an activity pattern from the test set is assigned to a target class from the training set (pure or closely related odor; see also Figure 5A, C). |