
Fig. 4 - Supplemental 2
- ID
- ZDB-FIG-250214-73
- Publication
- Meissner-Bernard et al., 2025 - Geometry and dynamics of representations in a precisely balanced memory network related to olfactory cortex
- Other Figures
- All Figure Page
- Back to All Figure Page
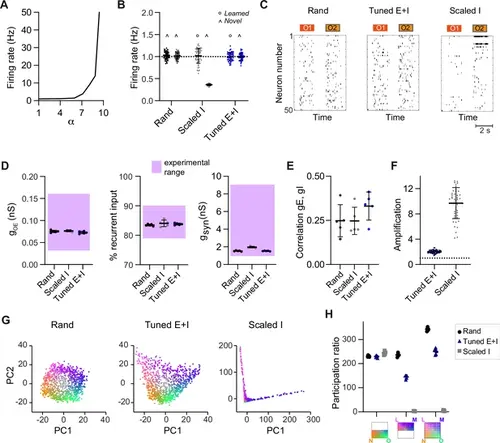
Geometry and dynamics in a simple model with equal parameters for excitation and inhibition. (A) Firing rates averaged over all E neurons as a function of α (mean across five networks). (B) Mean firing rate in response to learned odors or novel odors. Each data point represents one network-odor pair (n = 5 networks, 10 odors). Mean ± SD. (C) Spike raster plots showing responses of 50 E neurons to 2 odors (O1: novel odor; O2: learned odor). (D) Left: Synaptic conductance contributed by afferents from the olfactory bulb (OB) during odor stimulation (gOE). Middle: Total odor-evoked synaptic conductance gsyn. Right: Percentage of E input contributed by recurrent connections during odor stimulation. Each dot represents one network (average over 10 odors); n = 5 networks. (E) Co-tuning: correlation between time-averaged E and I conductances in response to different odors, average across neurons. (F) Amplification within assemblies, calculated as the ratio between mean firing rates in response to learned odors averaged across assembly neurons in a structured network (Scaled I or Tuned E+I) and the same neurons in the corresponding rand network. (G) Projection of activity patterns in pDpsim in response to the odor subspace described in Figure 4 onto the first two principal components (PCs). Representative examples of different networks. (H) Participation ratio (similar to Figure 4F): activity evoked by novel odors and related mixtures (left), activity evoked by learned odors and related mixtures (center), and activity evoked by all stimuli (right). |