
Fig. 3 - Supplemental 1
- ID
- ZDB-FIG-250214-70
- Publication
- Meissner-Bernard et al., 2025 - Geometry and dynamics of representations in a precisely balanced memory network related to olfactory cortex
- Other Figures
- All Figure Page
- Back to All Figure Page
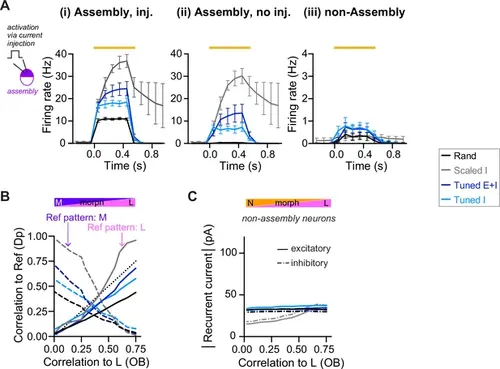
Pattern completion: additional results. (A) Artificial reactivation of E assemblies. During 6 Hz baseline activity of the olfactory bulb (OB), a subset of the assembly neurons was artificially reactivated by current injection (500 ms, 28 pA). Mean firing rates were quantified in the injected assembly neurons (i), in the remaining, non-injected assembly or pseudo-assembly neurons (ii), and in the non-assembly neurons (iii) as a function of time. The orange bar indicates duration of current injection. Average over 10 assemblies. n = 8 networks (mean ± SD). (B) Correlation between activity patterns across E neurons (output patterns) evoked by a series of input patterns representing a morph of one learned odor into another learned odor. Correlations between output patterns are plotted as a function of the correlation between the corresponding OB patterns. (C) Absolute value of the inhibitory and excitatory recurrent currents averaged over non-assembly neurons (see Figure 3F for the average over assembly neurons). |