
Fig. 4 - Supplemental 3
- ID
- ZDB-FIG-250214-74
- Publication
- Meissner-Bernard et al., 2025 - Geometry and dynamics of representations in a precisely balanced memory network related to olfactory cortex
- Other Figures
- All Figure Page
- Back to All Figure Page
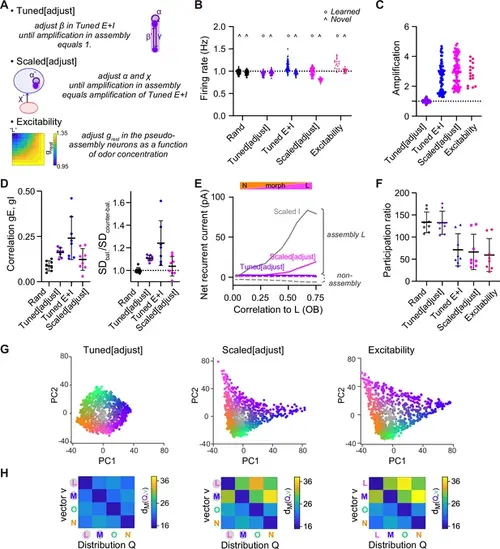
Manipulating amplification within assemblies. (A) Overview of modified pDpsim networks that were generated to manipulate amplification of activity within assemblies. (1) Tuned[adjust]: in existing Tuned E+I networks, the probability of I-to-E connections (β) is further increased until the mean activity within assemblies is similar to the activity of the corresponding pseudo-assemblies in rand networks. (2) Scaled[adjust]: Parameters α and χ are set such that the mean activity within assemblies matches the mean activity in assemblies of Tuned E+I networks. (3) Excitability: in rand networks, during presentation of odor L or M, the resting conductance grest of the corresponding pseudo-assembly neurons is decreased until their mean activity matches the mean activity of the Tuned E+I assembly. During mixture presentation, grest decreases linearly with the concentration of the odor. (B) Mean firing rate in response to learned or novel odors (see Figure 2F). Each data point represents one network-odor pair (n = 8 networks, 10 odors). In Scaled[adjust], mean firing rates for novel odors were lower than for learned odors. (C) Amplification within assemblies, calculated as the ratio between mean firing rates in response to learned odors averaged across assembly neurons (structured network) and the corresponding pseudo-assembly neurons (rand network); see Figure 2G. (D) Quantification of E/I co-tuning. Left: Correlation between time-averaged E and I conductances in response to different odors, average across neurons. Right: Ratio of dispersion of joint conductances along balanced and counter-balanced axes (see Figure 2H, I). Note that E/I co-tuning remained weak in Scaled[adjust] networks, inconsistent with experimental observations. (E) Sum of recurrent inhibitory and excitatory currents averaged over assembly or non-assembly neurons (see Figure 3E). In Tuned E+I and Scaled[adjust] networks, recurrent E inputs in assemblies slightly exceeded I inputs in the vicinity of learned odors. In Tuned[adjust], recurrent E and I inputs canceled out. (F) Quantification of dimensionality of neural activity by the participation ratio (see Figure 4F): activity evoked by the odor subspace. Each data point represents one network (n = 8). Mean ± SD. (G) Projection of activity patterns in response to the odor subspace onto the first two principal components (PCs) (representative examples of different networks; see Figure 4D). (H) The Mahalanobis distance dM between one activity vector (v) and reference classes (Q) (Methods and Figure 5B). dM was computed based on activity across subsets of 80 E neurons drawn from the four (pseudo-) assemblies with equal probability. |