
Fig. 6
- ID
- ZDB-FIG-250214-78
- Publication
- Meissner-Bernard et al., 2025 - Geometry and dynamics of representations in a precisely balanced memory network related to olfactory cortex
- Other Figures
- All Figure Page
- Back to All Figure Page
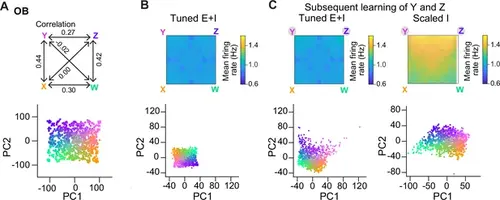
Representation of correlated patterns and resilience against additional memories. (A) Subspace delineated by four positively correlated odors (see Methods). Top: Correlations between pure odors. Bottom: Projection of olfactory bulb (OB) activity patterns onto the first two principal components (PCs). (B) Firing rates (top) and PC projection of output activity of a Tuned E+I network with 15 E/I assemblies that did not represent any of the four pure odors of the subspace. (C) Firing rates (top) and PC projection of output activity (bottom) after creation of two additional assemblies representing two of the pure odors (Y and Z). Left: Tuned E+I network. Right: Scaled I network. Note that in the Scaled I network, but not in the Tuned E+I network, firing rates evoked by newly learned odors were increased and patterns evoked by these odors were not well separated in PC space. |