
Fig. 2 - Supplemental 2
- ID
- ZDB-FIG-250214-68
- Publication
- Meissner-Bernard et al., 2025 - Geometry and dynamics of representations in a precisely balanced memory network related to olfactory cortex
- Other Figures
- All Figure Page
- Back to All Figure Page
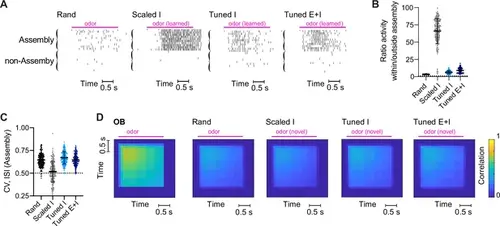
Structured networks: additional results. (A) Raster plots showing responses of assembly or non-assembly neurons to a learned odor. (B) Ratio of the average firing rate of (pseudo-)assembly neurons to non-assembly neurons in response to learned odors. Each data point represents one network-odor pair (n = 20 networks, 10 odors). Mean ± SD. (C) Coefficients of variation of the inter-spike interval (ISI) in assembly neurons. (D) Correlation between activity patterns across E neurons evoked by the same novel odor in different trials as a function of time. Pink bar indicates odor presentation. Note that correlations in response to novel odors are similar across networks and different from responses to learned odors in Scaled and Tuned networks (Figure 2E). |