
Fig. 5
- ID
- ZDB-FIG-250214-75
- Publication
- Meissner-Bernard et al., 2025 - Geometry and dynamics of representations in a precisely balanced memory network related to olfactory cortex
- Other Figures
- All Figure Page
- Back to All Figure Page
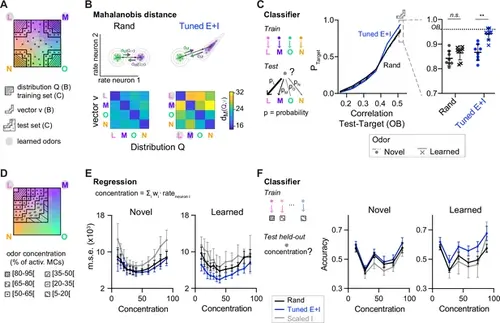
Distance relationships and classification of odor representations. (A) Odor-evoked activity patterns used as class distributions and vectors (B) or training and test sets (C). Same odor subspace as in Figure 4. (B) Top: Schematic illustration of Mahalanobis distance dM. Bottom: dM between one activity vector (v) and reference classes (Q) in rand and Tuned E+I networks. dM was computed based on the activity patterns of 80 E neurons drawn from the four (pseudo-) assemblies. Average of 50 draws. Note that dM between patterns related to a learned odor and non-matching reference classes was higher in Tuned E+I networks. (C) Pattern classification probability quantified by quadratic discriminant analysis (QDA). PTarget quantifies the probability that an activity pattern from the test set (odor mixtures, see A) is assigned to a target class from the training set (pure or closely related odor; see A). Left: Classification probability as a function of the similarity (Pearson correlation) between the test and target odors in the olfactory bulb (OB) (input patterns). Note enhanced classification probability for patterns evoked by odors similar to learned odors in Tuned E+I networks. Right: Classification probability for patterns similar to the training set (see A). Each data point represents one network (n = 8, mean ± SD; Wilcoxon signed-rank test, **: p < 0.01). (D) The odor subspace of Figure 4 was subdivided in classes reflecting different concentrations of one of the pure odors (Methods). Odor concentration is defined here as the percentage of the 150 mitral cells representing a given odor that are activated. (E) The concentration of a given odor was regressed against the mean firing rates of a subset of neurons (Methods). Mean square error (squared difference between the actual concentration and the estimated concentration). (F) Accuracy of a linear support vector machine (SVM) in predicting the concentration of a novel (left) or learned odor (right) in a mixture. Each data point represents one network (n = 8, mean ± SD). |