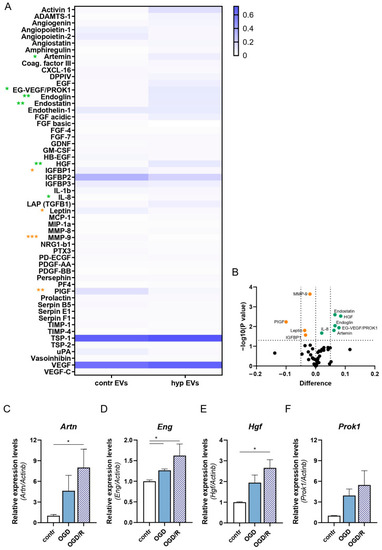
Analysis of the angiogenic protein cargo of hypEVs and contrEVs. (A) Proteome profiling analysis was performed on contrEVs and hypEVs. Protein content in EVs was quantified by micro-BCA for equal protein input (200 µg). The mean pixel density for each angiogenesis-related factor, expressed as fold to positive reference dots, is represented in a heat-map. Duplicate analyses of separate EV preparations for each EV type are represented. The non-parametric t-test was performed for each factor. Orange asterisks represent factors that are significantly down-regulated (* p < 0.05, ** p < 0.01, *** p < 0.001) in hypEVs. Green asterisks represent factors that are significantly enriched (* p < 0.05, ** p < 0.01) in hypEVs. (B) The volcano plot reports the −log(p-value) (Y axis), graphed against the mean pixel density differences (X axis). Orange dots represent factors that are significantly down-regulated (p < 0.05) in hypEVs. Green dots represent factors that are significantly enriched (p < 0.05) in hypEVs. (C–F) Primary mouse microglial cells were isolated from the brain of adult healthy mice and stimulated in vitro with the OGD/R protocol. The mRNA levels of the identified pro-angiogenic markers (Artn, Eng, Hgf, and Prok1) were quantified by qRT-PCR. Expression levels are normalised to the house-keeping gene Actb. N = 3. Bars represent mean ± SEM. The Kruskal–Wallis test was applied (C–F), * p < 0.05.
|
