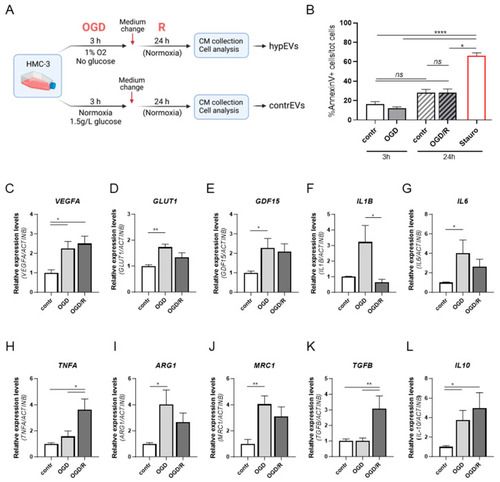
Activation of human microglia in response to OGD/R stimulation. (A) Schematic representation of the experimental workflow relative to the stimulation of HMC-3 cells with the OGD/R in vitro protocol. Following exposure to OGD/R, cells were detached for viability and gene expression analyses, while the conditioned medium (CM) was collected to subsequently isolate microglia-derived EVs. (B) Flow cytometric analysis of Annexin V in HMC-3 cells. Histograms represent the percentage of apoptotic cells (Annexin V+) over the total cells, quantified after OGD (3 h) and OGD/R (24 h) stimulation. Normoxic cells were used as controls at each time point. Cells treated with staurosporine were used as a positive control. Data are reported as relative percentages of apoptotic cells normalised to normoxic controls. (C–L) qRT-PCR analysis of hypoxia-response genes and microglia activation markers in HMC-3 cells upon OGD/R, confirming microglia activation. Relative gene expression levels were normalised to the housekeeping gene ACTB. Bars represent mean ± SEM. N = 3. The Kruskal–Wallis test for multiple comparisons was applied. * p < 0.05, ** p < 0.01, **** p < 0.0001, ns: not significant. CM: conditioned medium; OGD/R: oxygen–glucose deprivation/reperfusion.
|
