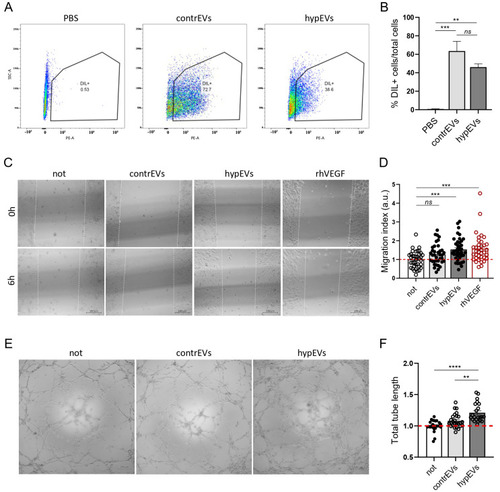
Functional characterisation of microglial EV effects on HBEC-5i brain microvascular cells. (A) Uptake of contrEVs and hypEVs by HBEC-5i cells. EVs isolated from contr-HMC-3-CM, hyp-HMC-3-CM, or the PBS vehicle were stained with Dil before treating HBEC-5i cells for 6 h. Representative panels of the gating strategy for cells exhibiting positive fluorescence in the PE (Dil) channel are shown. (B) The quantification represents the percentage of Dil+ cells after incubation with EVsDil, compared to cells incubated with PBSDil. (C,D) Scratch wound healing assay performed on HBEC-5i cells. A confluent endothelial cell monolayer was scratched, and cells were cultured in the presence of contrEVs or hypEVs, or with rhVEGF, in serum-free medium. Images of the scratch borders were acquired using an inverted optical microscope with a 4× objective, at time 0 h and after 6 h of culture. Image analysis was performed using ImageJ 1.53k. Results are expressed as a migration index, calculated as the difference between the starting (time 0 h) and the final (time 6 h) distance between the migrating fronts, normalised to the unstimulated control. (E,F) Tube formation assay performed on HBEC-5i cells. Cells were seeded on Matrigel and cultured for 6 h in the presence of contrEVs, hypEVs, or in medium alone. Images were acquired using a 4× objective. Histograms represent the cumulative tube length of the networks, as quantified using the Angiogenesis Analyzer plugin in ImageJ 1.53k. Scale bar: 100 µm. Results of at least three independent experiments are presented for all assays. Bars represent mean ± SEM. The Kruskal–Wallis test for multiple comparisons with Dunn’s post hoc was applied. ** p < 0.01, *** p < 0.001, **** p < 0.0001, ns: not significant.
|
