FIGURE

Figure 2

ID
ZDB-FIG-241219-144
Publication
Testa et al., 2024 - Hypoxic Human Microglia Promote Angiogenesis Through Extracellular Vesicle Release
Other Figures
All Figure Page
Back to All Figure Page
Figure 2

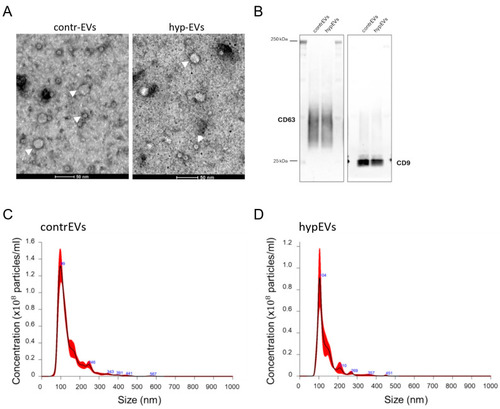
Characterization of EVs isolated from HMC-3-CM. (A) Transmission electron microscopy (TEM) images of EVs isolated from contr-HMC-3-CM (left) or hyp-HMC-3-CM (right). White arrowheads indicate EVs. Scale bar: 50 nm. (B,C) Western blot of EV lysates, validating the expression of EV-associated proteins CD63 and CD9 in the purified samples. (C,D) Representative pictures of the nanoparticle tracking analysis (NTA) of EVs isolated by ultrafiltration. The plots represent the size distributions of EVs, displaying the estimated concentration (particles/mL) for each particle size (nm), in both control and hypoxic conditions. The highest peaks and indicated numbers represent the mode vesicle size (99 nm in contrEVs and 104 nm in hypEVs), highlighting an enrichment in vesicles in the small EV (sEV) range (<200 nm).

Expression Data

Expression Detail
Antibody Labeling
Phenotype Data

Phenotype Detail
Acknowledgments
This image is the copyrighted work of the attributed author or publisher, and ZFIN has permission only to display this image to its users. Additional permissions should be obtained from the applicable author or publisher of the image. Full text @ Int. J. Mol. Sci.