IMAGE

Figure 5

ID
ZDB-IMAGE-241219-147
Source
Figures for Testa et al., 2024
Image
Figure Caption

Figure 5

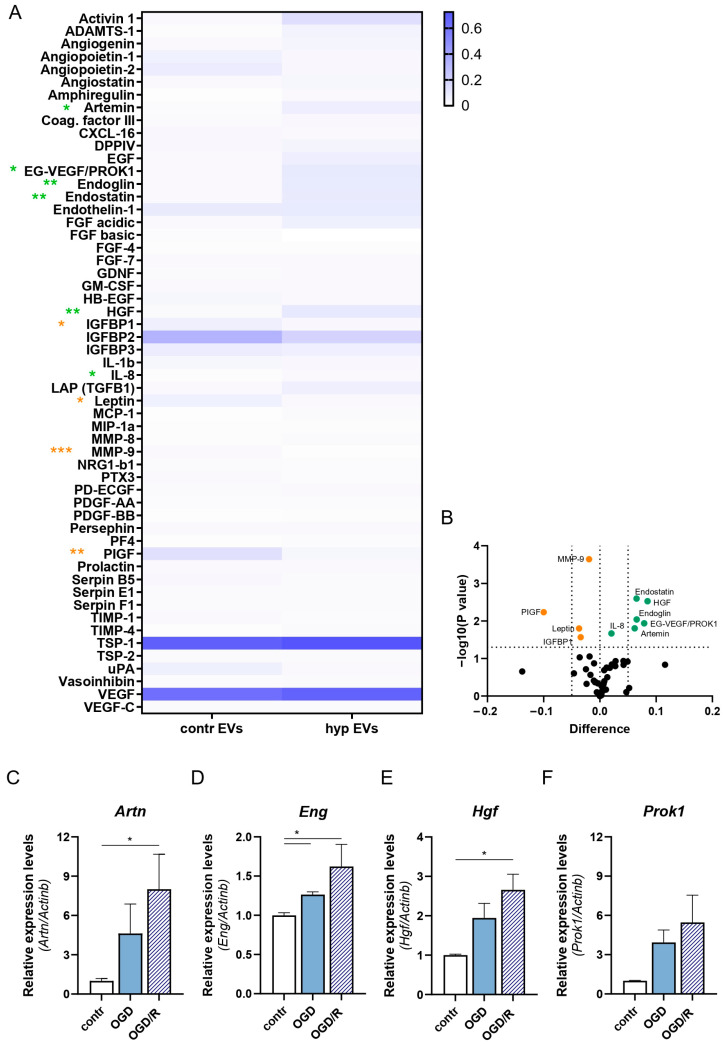
Analysis of the angiogenic protein cargo of hypEVs and contrEVs. (A) Proteome profiling analysis was performed on contrEVs and hypEVs. Protein content in EVs was quantified by micro-BCA for equal protein input (200 µg). The mean pixel density for each angiogenesis-related factor, expressed as fold to positive reference dots, is represented in a heat-map. Duplicate analyses of separate EV preparations for each EV type are represented. The non-parametric t-test was performed for each factor. Orange asterisks represent factors that are significantly down-regulated (* p < 0.05, ** p < 0.01, *** p < 0.001) in hypEVs. Green asterisks represent factors that are significantly enriched (* p < 0.05, ** p < 0.01) in hypEVs. (B) The volcano plot reports the −log(p-value) (Y axis), graphed against the mean pixel density differences (X axis). Orange dots represent factors that are significantly down-regulated (p < 0.05) in hypEVs. Green dots represent factors that are significantly enriched (p < 0.05) in hypEVs. (CF) Primary mouse microglial cells were isolated from the brain of adult healthy mice and stimulated in vitro with the OGD/R protocol. The mRNA levels of the identified pro-angiogenic markers (Artn, Eng, Hgf, and Prok1) were quantified by qRT-PCR. Expression levels are normalised to the house-keeping gene Actb. N = 3. Bars represent mean ± SEM. The Kruskal–Wallis test was applied (CF), * p < 0.05.

Acknowledgments
This image is the copyrighted work of the attributed author or publisher, and ZFIN has permission only to display this image to its users. Additional permissions should be obtained from the applicable author or publisher of the image. Full text @ Int. J. Mol. Sci.