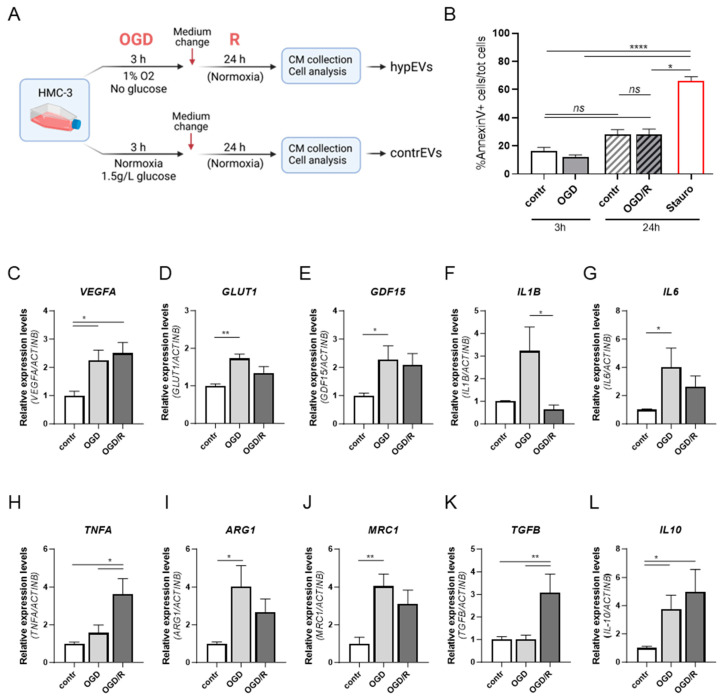
Activation of human microglia in response to OGD/R stimulation. (A) Schematic representation of the experimental workflow relative to the stimulation of HMC-3 cells with the OGD/R in vitro protocol. Following exposure to OGD/R, cells were detached for viability and gene expression analyses, while the conditioned medium (CM) was collected to subsequently isolate microglia-derived EVs. (B) Flow cytometric analysis of Annexin V in HMC-3 cells. Histograms represent the percentage of apoptotic cells (Annexin V+) over the total cells, quantified after OGD (3 h) and OGD/R (24 h) stimulation. Normoxic cells were used as controls at each time point. Cells treated with staurosporine were used as a positive control. Data are reported as relative percentages of apoptotic cells normalised to normoxic controls. (C–L) qRT-PCR analysis of hypoxia-response genes and microglia activation markers in HMC-3 cells upon OGD/R, confirming microglia activation. Relative gene expression levels were normalised to the housekeeping gene ACTB. Bars represent mean ± SEM. N = 3. The Kruskal–Wallis test for multiple comparisons was applied. * p < 0.05, ** p < 0.01, **** p < 0.0001, ns: not significant. CM: conditioned medium; OGD/R: oxygen–glucose deprivation/reperfusion.
Acknowledgments
This image is the copyrighted work of the attributed author or publisher, and
ZFIN has permission only to display this image to its users.
Additional permissions should be obtained from the applicable author or publisher of the image.
Full text @ Int. J. Mol. Sci.
Your Input Welcome
Thank you for submitting comments. Your input has been emailed to ZFIN curators who may contact you if
additional information is required.
Oops. Something went wrong. Please try again later.