IMAGE

FIGURE 7

ID
ZDB-IMAGE-240118-24
Source
Figures for Chen et al., 2024
Image
Figure Caption

FIGURE 7

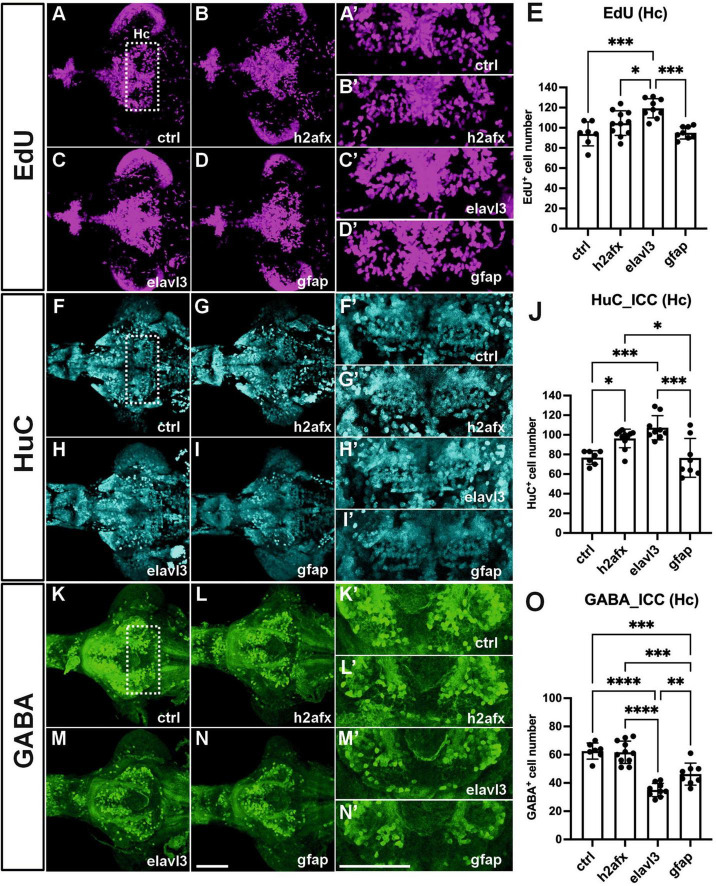
Transgenic expression of zebrafish angpt1 increases proliferation and HuC-positive cells but reduces GABAergic neurons. 5-dpf dissected brains were collected from Turku wild-type embryos injected with Tol2 constructs, including control or angpt1 transgene driven by h2afx, elavl3, and gfap promoter at the one-cell stage. Brain samples were stained with anti-HuC and anti-GABA antibodies following the EdU assay. EdU-proliferation images shown in (A) control (B)h2afx: angpt1(C)elavl3: angpt1(D)gfap: angpt1(E) Quantification of EdU-positive cell numbers in the Hc region [N = 7–11 per injected group, F(3, 31) = 10.75 P < 0.0001]. HuC-immunostaining images shown in (F) control (G)h2afx: angpt1(H)elavl3: angpt1(I)gfap: angpt1(J) Quantification of HuC-positive cell numbers in the Hc region [N = 7–11 per injected group, F(3, 31) = 11.58, P < 0.0001]. GABA-immunostaining images show (K) control (L)h2afx: angpt1(M)elavl3: angpt1(N)gfap: angpt1(O) Quantification of GABA-positive cell numbers in the Hc region [N = 7–11 per injected group, F(3, 31) = 33.92, P < 0.0001]. (A’–N’) Show the high magnification images corresponding to the white rectangular area in the Hc region shown in (A) and equivalent in (B–N). EdU-positive cells are displayed in magenta, HuC-positive cells in cyan, and GABA-positive cells in green. Hc, caudal hypothalamus. Statistical analysis is shown in mean ± SD by an ordinary one-way ANOVA with the Tukey multiple comparisons test. *p < 0.05, **p < 0.01, ***p < 0.001 and ****p < 0.0001. Scale bar is 200 μm.

Acknowledgments
This image is the copyrighted work of the attributed author or publisher, and ZFIN has permission only to display this image to its users. Additional permissions should be obtained from the applicable author or publisher of the image. Full text @ Front. Cell. Neurosci.