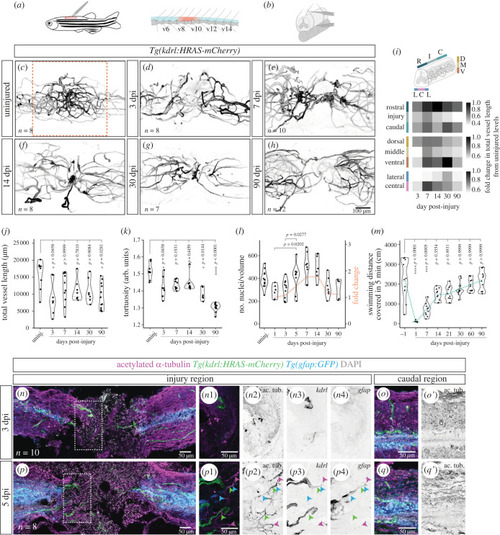
Changes in vascular distribution and morphology in response to spinal cord injury. (a) Schematic of the location of the SC injury in adult zebrafish. (b) Schematic of a contusion injury, using forceps to compress the SC between neural arches. (c–h) Wholemount SCs with labelled endothelial cells (Tg(kdrl:HRAS-mCherry)) in uninjured and 3, 7, 14, 30 and 90 dpi. Images are of different animals representative of each time-point. (i) Fold change in total vessel length relative to uninjured levels over time post-injury in different regions along the rostral-caudal axis, the dorsal–ventral axis and the left-right axis. (j) Average vessel length over time post-injury. (k) Average vessel tortuosity (vessel length/euclidean distance) over time post-injury. (l) Number of endothelial nuclei over time post-injury. The orange dashed line indicates the fold change in the number of nuclei relative to 1 dpi (right-side axis). (m) Swimming distance covered in an open field test from 1 day before injury to 90 dpi (green dashed line represents the mean value). (n,p) Longitudinal sections of transected SCs with labelled axons (anti-acetylated alpha-tubulin antibody), ECs (Tg(kdrl:HRAS-mCherry)), glial cells (Tg(gfap:GFP)) and nuclear DAPI staining, at 3 (n) and 5 dpi (p). n1–n4. Magnifications of box in (n) showing blood vessels, but not axons or glial cells, present in the injured region at 3 dpi. p1–p4. Magnifications of box in (p) showing axons adjacent to blood vessels (green arrowheads), glial projections (blue arrowheads) or alone (magenta arrowheads). (o,o′), (q,q′). SC region 2 mm caudally to the injury. Statistical tests: Kruskal–Wallis test followed by Dunn's multiple comparisons post hoc test relative to uninjured control (j,k,m) or between all conditions (l) (p-values > 0.05 in (l) are not shown).
|
