FIGURE SUMMARY
Title

Development and repair of blood vessels in the zebrafish spinal cord

Authors
Ribeiro, A., Rebocho da Costa, M., de Sena-Tomás, C., Rodrigues, E.C., Quitéria, R., Maçarico, T., Rosa Santos, S.C., Saúde, L.
Source
Full text @ Open Biol.

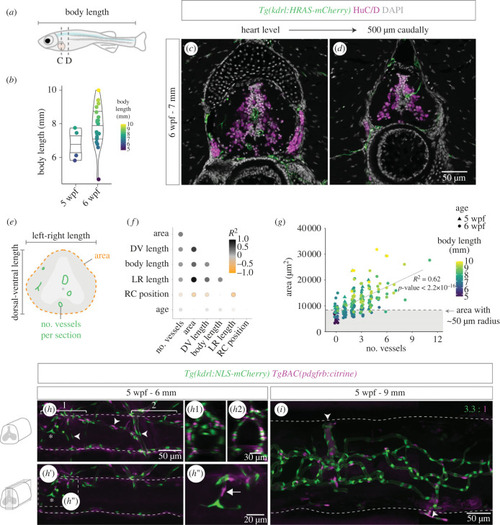
Spinal cord vascularization in juvenile zebrafish. (a) Definition of body length and rostral–caudal region analysed in juvenile zebrafish. (b) Body length (y-axis and symbol colour) in juvenile fish with 5 (n = 4) or 6 (n = 20) weeks post fertilization (wpf). (c,d) 6 wpf fish sections at the heart level (c) and 500 µm caudally (d) with labelled endothelial cells (Tg(kdrl:HRAS-mCherry)), HuC/D+ neurons and nuclear DAPI staining. (e) Schematic showing the parameters quantified in the imaged sections. (f) Correlation matrix dot plot of the quantified parameters: area; DV (dorsal–ventral) length; body length; LR (left-right) length; RC (rostral–caudal) position (starting at the heart level); age and number of vessels per section. Dot size and colour represent the Spearman correlation coefficient. (g) SC area relative to number of vessels per section in all sections analysed. Symbol shape indicates age and symbol colour indicates body length. Dashed line corresponds to average SC area in sections with 1 vessel inside. (j) 5 wpf juvenile with 6 mm with labelled endothelial nuclei (Tg(kdrl:NLS-mCherry)) and perivascular cells (TgBAC(pdgfrb:citrine)) (arrowheads identify the perineural vascular plexus and the asterisk marks a vessel inside the spinal cord). (h1,h2) Transversal views of the regions marked with brackets in h. (h′) Ingressing blood vessel in the central region with co-recruited mural cells (arrow) (magnification in h″). (i) A 9 mm fish SC with a more complex vasculature and high perivascular coverage (3.3 ECs per perivascular cell ±0.28, n = 3). Arrowheads label points of connection between the intraspinal network and external vessels.

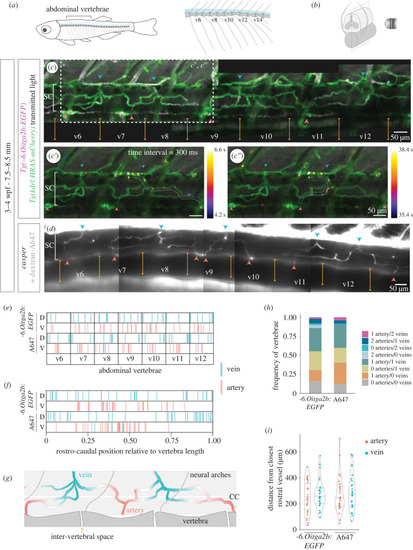
Direction of blood flow and distribution of arteries and veins in the developing spinal cord vasculature. (a) Schematic of vertebral column in zebrafish, with a magnified view of abdominal vertebrae on the right. (b) Schematic of the SC plane acquired during live imaging. (c) Projection of 500 time-frames (300 ms interval) acquired in live 3–4 wpf fish with labelled ECs (Tg(kdrl:HRAS-mCherry)) and thrombocytes (Tg(-6.0itga2b:EGFP)) (n = 7). The intervertebral spaces are labelled with orange arrows, arteries in red and veins in blue. c′,c″. Projections of the region shown in (c) with flowing cells colour-coded by time (electronic supplementary material, movie S1). (d) Projection of 1500 time-frames (17 ms interval) acquired in live 3–4 wpf casper fish injected intracardially with 10 KDa dextran conjugated with Alexa-647 (A647) (n = 8). Vertebrae, arteries and veins were identified as in (c) (electronic supplementary material, movie S3). (e) Rostral-caudal distribution of arteries and veins in abdominal vertebrae, with position normalized to vertebra length, in the two blood flow models: Tg(-6.0itga2b:EGFP) and dextran-A647. (f) Combination of all vertebrae and all samples shown in (f) in a single plot. (g) Schematic of the organization of arteries and veins in the developing SC vasculature. (CC, central canal). (h) Frequency of vertebrae that present each combination of number of arteries and veins. (i) Distance in µm of each artery/vein from the closest rostral artery/vein (each dot represents a vessel).

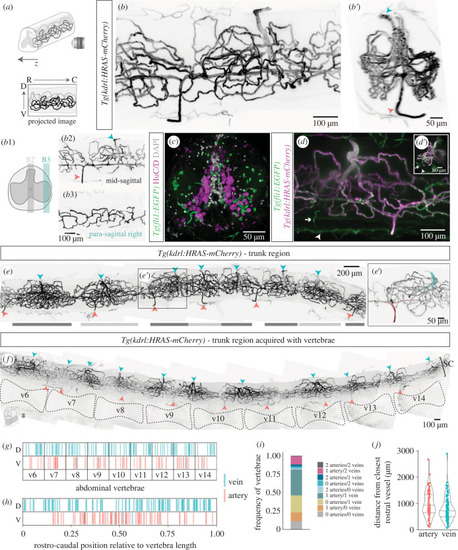
Organization of the spinal cord vasculature in adult zebrafish. (a) Schematic of light sheet image acquisition of wholemount cleared SCs (R, rostral; C, caudal; V, ventral; D, dorsal). (b) Wholemount SC with labelled ECs (Tg(kdrl:HRAS-mCherry)), with transversal view in b′. Arrowheads label arteries in red and veins in blue. b1. Schematic of the 100 µm regions projected in b2,b3. (c) Transverse SC section (Tg(fli1:EGFP)) co-labelled for HuC/D+ neurons and nuclear DAPI staining. (d) Whole SC (Tg(fli1:EGFP;Tg(kdrl:HRAS-mCherry)) with external fli1+/kdrl vessels (arrows). (d′) Inset with transversal view of the image. (e) Composite of the trunk SC vasculature (Tg(kdrl:HRAS-mCherry). Clusters of vessels are identified by alternating dark and light grey bars. (e′) Magnification of the region in (e), highlighting an artery in red with two branches and smaller calibre than the vein labelled in blue. A capillary cluster converges to the vein. (f) Composite of the trunk SC vasculature (Tg(kdrl:HRAS-mCherry) acquired with vertebrae. (g) Rostral–caudal distribution of arteries and veins in abdominal vertebrae, with position normalized to vertebra length. (h) Combination of all vertebrae and all samples shown in (h) in a single plot. (i) Frequency of vertebrae that present each combination of number of arteries and veins. (j) Distance in µm of each artery/vein from the closest rostral artery/vein (each dot represents a vessel).

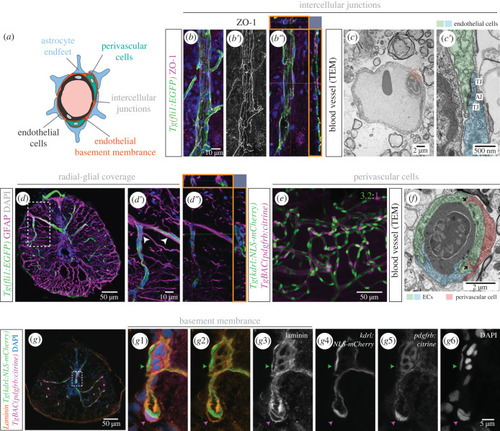
Organization of the blood-spinal cord barrier in adult zebrafish. (a) Schematic of BSCB components. (b-b″). Tg(fli1:EGFP) SC section, co-stained with the tight junction marker ZO-1 (b′). Orthogonal views (orange squares in b″) shows close proximity between ZO-1 and fli1:EGFP. (c-c′). TEM image of a blood vessel, with a magnification of the orange box in (c′) showing intercellular junctions between ECs: tight junctions (TJ) and adherens junctions (AJ). (d–d″). Transverse SC section labelled ECs Tg(fli1:EGFP) and radial glial cells (anti-GFAP antibody) with projections adjacent to ECs (arrowheads in (d′) and orthogonal views in orange squares in (d″)). (e) Wholemount SC with labelled endothelial nuclei (Tg(kdrl:NLS-mCherry)) and pericytes (TgBAC(pdgfrb:citrine)) (3.2 ECs per perivascular cell ± 0.59, n = 7). (f) TEM image of a cross-section of a blood vessel, showing two contacting ECs (in blue and green) and an associated pericyte (in red). (g) Transverse SC section with labelled endothelial nuclei (Tg(kdrl:NLS-mCherry)), pericytes (TgBAC(pdgfrb:citrine)), co-labelled with an anti-laminin antibody to identify the basement membrane (BM) and DAPI-labelled nuclei. (g1–g6) Magnifications of the region labelled in (g) showing the separate channels. The green arrowhead points to the BM over an endothelial nucleus and the magenta arrowhead identifies a pericyte embedded in the endothelial BM.

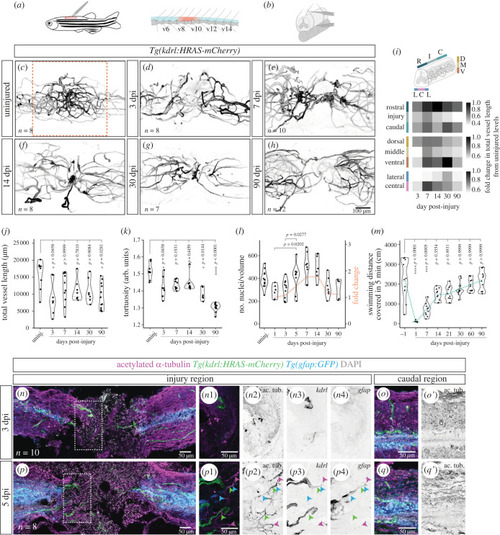
Changes in vascular distribution and morphology in response to spinal cord injury. (a) Schematic of the location of the SC injury in adult zebrafish. (b) Schematic of a contusion injury, using forceps to compress the SC between neural arches. (c–h) Wholemount SCs with labelled endothelial cells (Tg(kdrl:HRAS-mCherry)) in uninjured and 3, 7, 14, 30 and 90 dpi. Images are of different animals representative of each time-point. (i) Fold change in total vessel length relative to uninjured levels over time post-injury in different regions along the rostral-caudal axis, the dorsal–ventral axis and the left-right axis. (j) Average vessel length over time post-injury. (k) Average vessel tortuosity (vessel length/euclidean distance) over time post-injury. (l) Number of endothelial nuclei over time post-injury. The orange dashed line indicates the fold change in the number of nuclei relative to 1 dpi (right-side axis). (m) Swimming distance covered in an open field test from 1 day before injury to 90 dpi (green dashed line represents the mean value). (n,p) Longitudinal sections of transected SCs with labelled axons (anti-acetylated alpha-tubulin antibody), ECs (Tg(kdrl:HRAS-mCherry)), glial cells (Tg(gfap:GFP)) and nuclear DAPI staining, at 3 (n) and 5 dpi (p). n1–n4. Magnifications of box in (n) showing blood vessels, but not axons or glial cells, present in the injured region at 3 dpi. p1–p4. Magnifications of box in (p) showing axons adjacent to blood vessels (green arrowheads), glial projections (blue arrowheads) or alone (magenta arrowheads). (o,o′), (q,q′). SC region 2 mm caudally to the injury. Statistical tests: Kruskal–Wallis test followed by Dunn's multiple comparisons post hoc test relative to uninjured control (j,k,m) or between all conditions (l) (p-values > 0.05 in (l) are not shown).

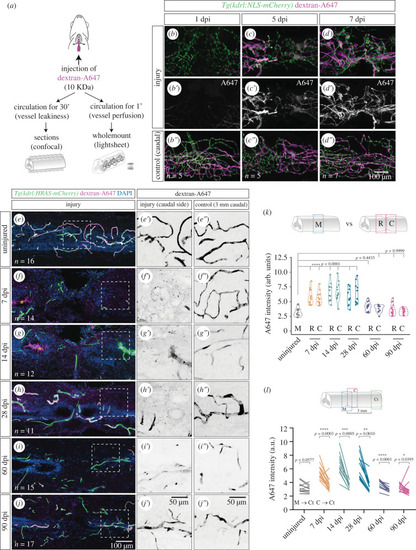
Re-establishment of the blood-spinal cord barrier after injury. (a) Schematic of the vessel perfusion/permeability assay with 10KDa dextran-Alexa647 (A647), adapted from [37]. (b–d″). Wholemount SCs with labelled endothelial nuclei (Tg(kdrl:NLS-mCherry)), perfused with dextran-A647 for 1 min and analysed at 1, 5 and 7 dpi. (b′–d′). A region 2 mm caudally to the injury is used as control of the injection (b″–d″). (e–j) Longitudinal sections of contusion-injured SCs with labelled ECs (Tg(kdrl:HRAS-mCherry)), perfused with dextran-A647 for 30 min and with DAPI-stained nuclei. Orange asterisks highlight the accumulation of dextran-A647 in the central canal in f,g. Magnified views of the dextran-A647 signal in the caudal side of the injury are shown in e′–j′. and a control region 3 mm caudal to the injury is shown in e″–j″. (k) Quantification of extravascular intensity of dextran-A647 in the rostral (R) and caudal (C) side of the injury and compared to the middle region (M) of uninjured SCs. (l) Comparison of dextran-A647 extravascular intensity in the caudal side of the injury (or a corresponding region in uninjured SCs) with a control region 3 mm caudal to the injury. Each line shows the change between the two regions in individual SCs. Statistical tests: Kruskal–Wallis test followed by Dunn's multiple comparisons post hoc test relative to uninjured control (k) and Wilcoxon matched-pairs signed rank test (l).

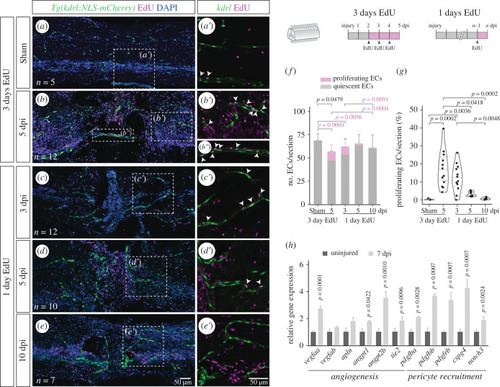
Endothelial proliferation during vascular repair. (a–e) Longitudinal SC sections with labelled ECs (Tg(kdrl:NLS-mCherry)), EdU staining and nuclear DAPI staining, with magnified views (a′–e′) showing proliferating ECs (arrowheads). Repeated EdU injections were performed three consecutive days before SC collection at 5 days after sham/spinal cord contusion injury (a,b). Single EdU injections were administered 1 day before SC collection at 3, 5 and 10 dpi (c,d,e). (f) Total number of ECs per section, grouped as proliferating (EdU+) or quiescent (EdU) cells. (g) Fraction of proliferating ECs (EdU+ ECs / total ECs) per section. (h) Relative gene expression in uninjured (n = 6) and 7 dpi (n = 2) SCs, measured by qPCR, standardized to gapdh and normalized to the uninjured mean. Data represent mean ± s.d. Statistical tests: Kruskal–Wallis test followed by Dunn's multiple comparisons post hoc test (f,g); two-tailed unpaired t-test (O); (p-values > 0.05 are not shown).

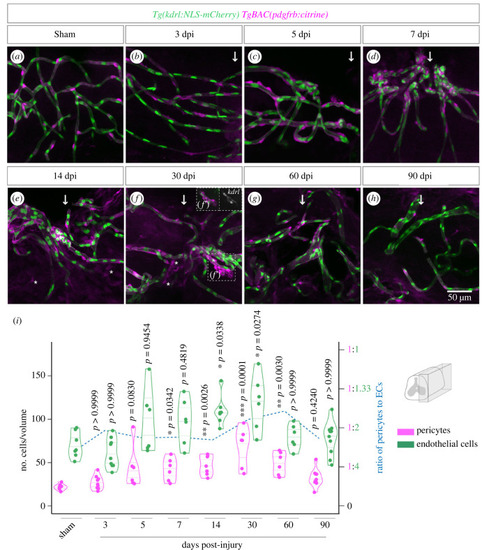
Pericyte recruitment during vascular repair. (a–h) Lateral region (90 µm depth) of wholemount SCs with labelled endothelial nuclei (Tg(kdrl:NLS-mCherry)) and pericytes (TgBAC(pdgfrb:citrine)) after sham injury and between 3 and 90 days post-contusion injury. The arrows identify the position of the injury. Asterisks identify cells with low pdgfrb:citrine expression not associated with vessels. Region in (f′) shows a vessel with low levels of kdrl:NLS-mCherry and associated pericytes (in inset, kdrl levels are enhanced relative to the main figure). (i) Total number of pericytes and ECs over time post-injury. Ratio of pericytes to ECs is shown as a dashed blue line (right-side axis). Statistical tests: Kruskal–Wallis test followed by Dunn's multiple comparisons post hoc test relative to uninjured control (i).

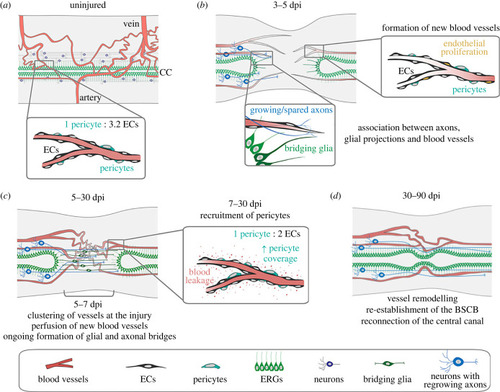
Model of vascular repair in the zebrafish spinal cord. (a) Organization of the SC vasculature in adult zebrafish. Ventral arteries give rise to vessels that run along the ependymal canal and branch as grey matter capillaries. These capillaries aggregate around collecting dorsal veins, forming vascular clusters. Small calibre vessels are supported by pericytes. (b) SCI triggers early endothelial proliferation. New blood vessels rapidly invade the injured tissue and are observed in proximity of glial projections and growing/spared axons. (c) Rostral and caudal growing vessels anastomose in the injured region and become perfused between 5 and 7 dpi, as the glial and axonal bridges are formed. The initial vascular repair creates a network of irregular vessels. Pericytes are recruited to new blood vessels from 7 dpi until 30 dpi, but vessels remain permeable during this period. (d) Between 30 and 90 dpi the vascular network is remodelled and the BSCB is re-established, allowing for the long-term and functional vascularization of the regenerated SC.

Acknowledgments
This image is the copyrighted work of the attributed author or publisher, and ZFIN has permission only to display this image to its users. Additional permissions should be obtained from the applicable author or publisher of the image. Full text @ Open Biol.