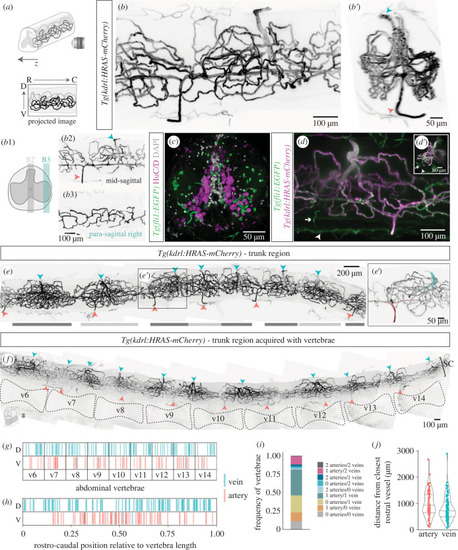
Organization of the spinal cord vasculature in adult zebrafish. (a) Schematic of light sheet image acquisition of wholemount cleared SCs (R, rostral; C, caudal; V, ventral; D, dorsal). (b) Wholemount SC with labelled ECs (Tg(kdrl:HRAS-mCherry)), with transversal view in b′. Arrowheads label arteries in red and veins in blue. b1. Schematic of the 100 µm regions projected in b2,b3. (c) Transverse SC section (Tg(fli1:EGFP)) co-labelled for HuC/D+ neurons and nuclear DAPI staining. (d) Whole SC (Tg(fli1:EGFP;Tg(kdrl:HRAS-mCherry)) with external fli1+/kdrl− vessels (arrows). (d′) Inset with transversal view of the image. (e) Composite of the trunk SC vasculature (Tg(kdrl:HRAS-mCherry). Clusters of vessels are identified by alternating dark and light grey bars. (e′) Magnification of the region in (e), highlighting an artery in red with two branches and smaller calibre than the vein labelled in blue. A capillary cluster converges to the vein. (f) Composite of the trunk SC vasculature (Tg(kdrl:HRAS-mCherry) acquired with vertebrae. (g) Rostral–caudal distribution of arteries and veins in abdominal vertebrae, with position normalized to vertebra length. (h) Combination of all vertebrae and all samples shown in (h) in a single plot. (i) Frequency of vertebrae that present each combination of number of arteries and veins. (j) Distance in µm of each artery/vein from the closest rostral artery/vein (each dot represents a vessel).
|

