
Figure 6
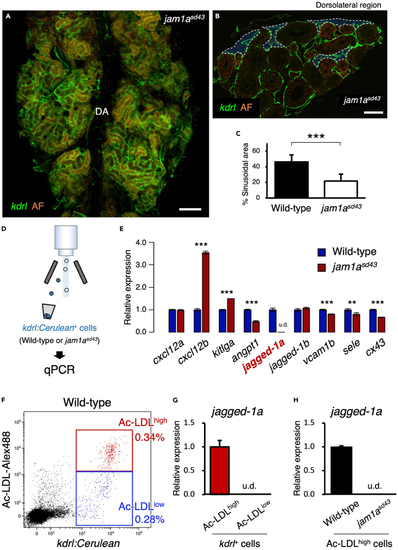
Sinusoids are reduced in the jam1asd43 kidney (A) Dorsal view of a jam1asd43kdrl:Cerulean kidney. DA, dorsal aorta. (B) Transverse section of a jam1asd43kdrl:Cerulean kidney. Blue areas outlined by the white dotted line denote the sinusoidal area. AF in A and B denotes auto-fluorescence of renal tubules. (C) Percentages of sinusoidal area in the wild-type or jam1asd43 kidney. Error bars, s.d. (n = 6 for each). (D) Schematic diagram of qPCR analysis in vascular endothelial cells from wild-type or jam1asd43 kidneys. (E) Expression of niche factor genes in vascular endothelial cells from wild-type or jam1asd43 kidneys. Error bars, s.d. (n = 4 for each). (F) Representative result of FCM analysis in wild-type kdrl:Cerulean animals injected with Alexa Fluor 488-conjugated Ac-LDL. kdrl:Cerulean+ endothelial cells were subdivided into two populations, Ac-LDLhigh and Ac-LDLlow. (G and H) Expression of jagged-1a in Ac-LDLhigh or Ac-LDLlow endothelial cells of wild-type animals (G) or in Ac-LDLhigh endothelial cells from wild-type or jam1asd43 kidneys (H). Error bars, s.d. (n = 4 for each). u.d., undetected. Bars, 200 μm (A); 40 μm (B); ∗∗p < 0.01; ∗∗∗p < 0.001. |
| Genes: | |
|---|---|
| Fish: | |
| Anatomical Terms: | |
| Stage: | Adult |
| Fish: | |
|---|---|
| Observed In: | |
| Stage: | Adult |