|
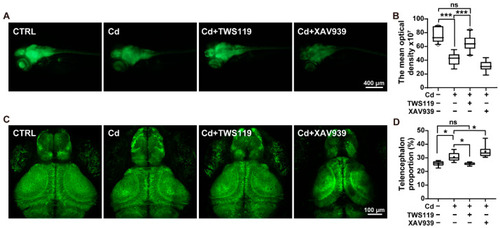
Involvement of zebrafish Wnt signaling pathway in Cd2+-induced neurodevelopmental disorders. (A,B) Fluorescence imaging of 6 dpf Tg(elavl3:EGFP) larvae and statistics of relative fluorescence intensity. (C,D) Confocal fluorescence imaging of the telencephalon and midbrain regions, as well as the statistics of telencephalon proportion. (E,F) Imaging of the PVL region in 6 dpf Tg(elavl3: EGFP) larvae and density statistics of PVN. (G–I) Imaging of trigeminal ganglion neurons and structural analysis in 24 hpf zebrafish embryos. (J) Relative expression of genes related to neurodevelopment and differentiation. In histograms, values are represented as mean ± SEM, while in boxplots, values are represented as median and mean, and whiskers show 90% confidence levels. The results of nonparametric test and ANOVA, as well as multiple comparison test are listed in Table S2. “*” indicates significant differences (* p < 0.05, ** p < 0.01, *** p < 0.001).
|