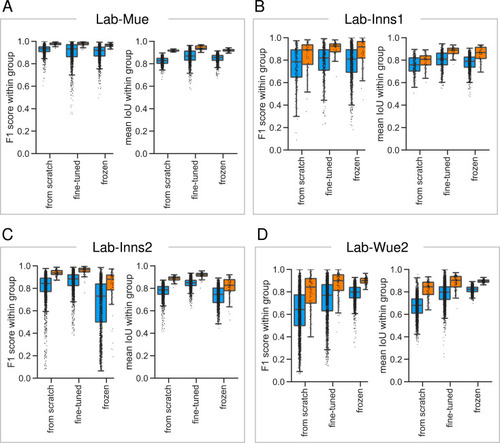
Figure 5—figure supplement 5.

Reliability of the consensus approaches across different datasets.

To asses the reliability and reproducibility of the consensus models and consensus ensembles strategies, we illustrate the within group MF1 score at a matching IoU-threshold of t=0.5 and the within group M¯IoU across different datasets. Color coding refers to the different DL strategies: blue to consensus models; orange to consensus ensembles. All images used for training were excluded from the analysis. The differences between the datasets highlight the difficulties in establishing a unified approach for automated fluorescent label annotation. (A) The Lab-Mue analysis comprises n = 24 images and the following models: Nconsensus models = 12 and Nconsensus ensembles = 3 for all initialization variants. (B) The Lab-Inns1 analysis comprises n = 20 images and the following models: Nfrom scratch consensus models = 6, Nfine-tuned consensus models = 8, Nfrozen consensus models = 12, and Nconsensus ensembles = 3 for all initialization variants. (C) The Lab-Inns2 analysis comprises n = 25 images and the following models: Nfrom scratch consensus models = 15, Nfine-tuned consensus models = 15, Nfrozen consensus models = 12, and Nconsensus ensembles = 3 for all initialization variants. (D) The Lab-Wue2 analysis comprises n = 25 images and the following models: Nfrom scratch consensus models = 15, Nfine-tuned consensus models = 15, Nfrozen consensus models = 12, and Nconsensus ensembles = 3 for each initialization variant.

Expression Data

Expression Detail
Antibody Labeling
Phenotype Data

Phenotype Detail
Acknowledgments
This image is the copyrighted work of the attributed author or publisher, and ZFIN has permission only to display this image to its users. Additional permissions should be obtained from the applicable author or publisher of the image. Full text @ Elife