
Figure 2—figure supplement 1.
- ID
- ZDB-FIG-201209-33
- Publication
- Segebarth et al., 2020 - On the objectivity, reliability, and validity of deep learning enabled bioimage analyses
- Other Figures
-
- Figure 1—figure supplement 1.
- Figure 1—figure supplement 1.
- Figure 1—figure supplement 2.
- Figure 2—figure supplement 1.
- Figure 2—figure supplement 1.
- Figure 2—figure supplement 2.
- Figure 2—figure supplement 3.
- Figure 2—figure supplement 4.
- Figure 3—figure supplement 1—source data 1.
- Figure 3—figure supplement 1—source data 1.
- Figure 4—source data 2.
- Figure 5—figure supplement 1.
- Figure 5—figure supplement 1.
- Figure 5—figure supplement 2.
- Figure 5—figure supplement 3.
- Figure 5—figure supplement 4.
- Figure 5—figure supplement 5.
- All Figure Page
- Back to All Figure Page
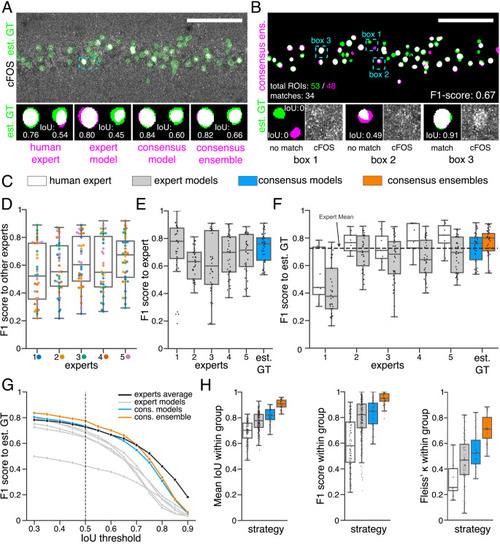
(A) Representative example of IoU MIoU calculations on a field of view (FOV) in a bioimage. Image raw data show the labeling of cFOS in a maximum intensity projection image of the CA1 region in the hippocampus (brightness and contrast enhanced). The similarity of estimated ground truth (est. GT) annotations (green), derived from the annotations of five expert neuroscientists, are compared to those of one human expert, an expert model, a consensus model, and a consensus ensemble (magenta, respectively). IoU results of two ROIs are shown in detail for each comparison (magnification of cyan box). Scale bar: 100 µm. (B) F1 score MF1 score calculations on the same FOV as shown in (A). The est. GT annotations (green; 53 ROIs) are compared to those of a consensus ensemble (magenta; 48 ROIs). IoU-based matching of ROIs at an IoU-threshold of t=0.5 is depicted in three magnified subregions of the image (cyan boxes 1-3). Scale bar: 100 µm. (C–H) All comparisons are performed exclusively on a separate image test set which was withheld from model training and validation. (C) Color coding refers to the individual strategies, as introduced in Figure 1: white: manual approach, gray: expert models, blue: consensus models, orange: consensus ensembles. (D) MF1 score between individual manual expert annotations and their overall reliability of agreement given as the mean of Fleiss‘ κ. (E) MF1 score between annotations predicted by individual models and the annotations of the respective expert (or est. GT), whose annotations were used for training. Nmodels per expert = 4. (F) MF1 score between manual expert annotations, the respective expert models, consensus models, and consensus ensembles compared to the est. GT as reference. A horizontal line denotes human expert average. Nmodels = 4, Nensembles = 4. (G) Means of MF1 score of the individual DL-based strategies and of the human expert average compared to the est. GT plotted for different IoU matching thresholds t. A dashed line indicates the default threshold t=0.5. Nmodels = 4, Nensembles = 4. (H) Annotation reliability of the individual strategies assessed as the similarities between annotations within the respective strategy. We calculated M̄IoU, MF1 score and Fleiss‘ κ. Nexperts = 5, Nmodels = 4, Nensembles = 4. |