
Figure 3—figure supplement 1—source data 1.
- ID
- ZDB-FIG-201209-39
- Publication
- Segebarth et al., 2020 - On the objectivity, reliability, and validity of deep learning enabled bioimage analyses
- Other Figures
-
- Figure 1—figure supplement 1.
- Figure 1—figure supplement 1.
- Figure 1—figure supplement 2.
- Figure 2—figure supplement 1.
- Figure 2—figure supplement 1.
- Figure 2—figure supplement 2.
- Figure 2—figure supplement 3.
- Figure 2—figure supplement 4.
- Figure 3—figure supplement 1—source data 1.
- Figure 3—figure supplement 1—source data 1.
- Figure 4—source data 2.
- Figure 5—figure supplement 1.
- Figure 5—figure supplement 1.
- Figure 5—figure supplement 2.
- Figure 5—figure supplement 3.
- Figure 5—figure supplement 4.
- Figure 5—figure supplement 5.
- All Figure Page
- Back to All Figure Page
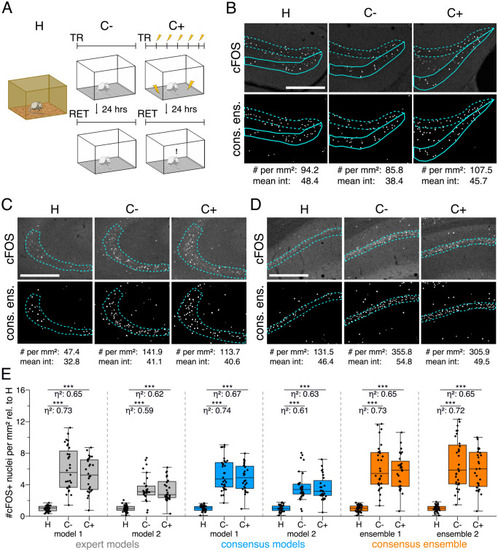
The figure introduces how three DL-based strategies are applied for annotation of a representative fluorescent label, here cFOS, in a representative image data set. Raw image data show behavior-related changes in the abundance and distribution of the protein cFOS in the dorsal hippocampus, a brain center for encoding of context-dependent memory. (A) Three experimental groups were investigated: Mice kept in their homecage (H), mice that were trained to a context, but did not experience an electric foot shock (C-) and mice exposed to five foot shocks in the training context (C+). 24 hr after the initial training (TR), mice were re-exposed to the training context for memory retrieval (RET). Memory retrieval induces changes in cFOS levels. (B–D) Brightness and contrast enhanced maximum intensity projections showing cFOS fluorescent labels of the three experimental groups (H, C-, C+) with representative annotations of a consensus ensemble, for each hippocampal subregion. The annotations are used to quantify the number of cFOS-positive nuclei for each image (#) per mm2 and their mean signal intensity (mean int., in bit-values) within the corresponding image region of interest, here the neuronal layers in the hippocampus (outlined in cyan). In B: granule cell layer (supra- and infrapyramidal blade), dotted line: suprapyramidal blade, solid line: infrapyramidal blade. In C: pyramidal cell layer of CA3; in D: pyramidal cell layer in CA1. Scale bars: 200 µm. (E) Analyses of cFOS-positive nuclei per mm2, representatively shown for stratum pyramidale of CA1. Corresponding effect sizes are given as η2 for each pairwise comparison. Two quantification results are shown for each strategy and were selected to represent the lowest (model 1 or ensemble 1) and highest (model 2 or ensemble 2) effect sizes (increase in cFOS) reported within each annotation strategy. Total analyses performed: Nexpert models = 20, Nconsensus models = 36, Nconsensus ensembles = 9. Number of analyzed mice (N) and images (n) per experimental condition: NH = 7, NC- = 7, NC+ = 6; nH = 36, nC- = 32, nC+ = 28. ***p<0.001 with Mann-Whitney-U test. Statistical data are available in Figure 3—source data 1. |