
Figure 5—figure supplement 4.
- ID
- ZDB-FIG-201209-47
- Publication
- Segebarth et al., 2020 - On the objectivity, reliability, and validity of deep learning enabled bioimage analyses
- Other Figures
-
- Figure 1—figure supplement 1.
- Figure 1—figure supplement 1.
- Figure 1—figure supplement 2.
- Figure 2—figure supplement 1.
- Figure 2—figure supplement 1.
- Figure 2—figure supplement 2.
- Figure 2—figure supplement 3.
- Figure 2—figure supplement 4.
- Figure 3—figure supplement 1—source data 1.
- Figure 3—figure supplement 1—source data 1.
- Figure 4—source data 2.
- Figure 5—figure supplement 1.
- Figure 5—figure supplement 1.
- Figure 5—figure supplement 2.
- Figure 5—figure supplement 3.
- Figure 5—figure supplement 4.
- Figure 5—figure supplement 5.
- All Figure Page
- Back to All Figure Page
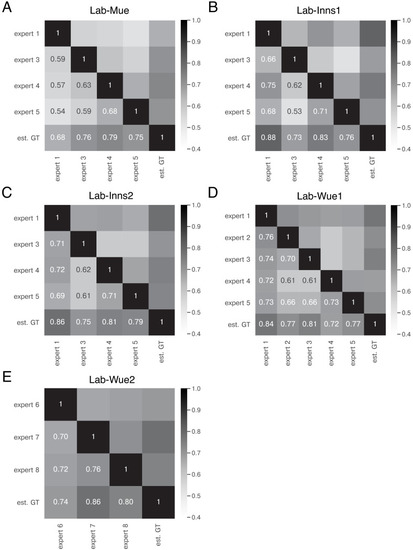
The heatmaps show the mean of |