|
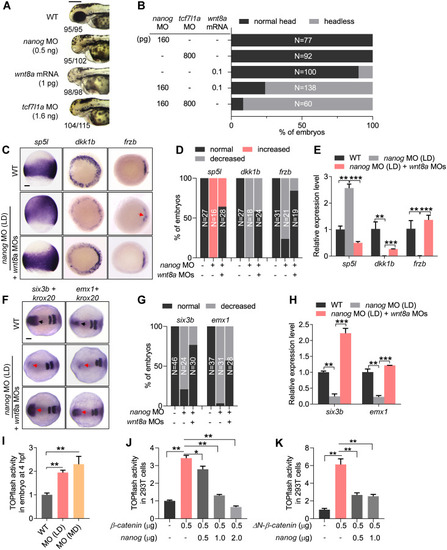
<italic>Nanog</italic> negatively regulates Wnt/β-catenin signaling.(A) The embryos injected with LD nanog MO (0.5 ng) exhibit the similar phenotypes—telencephalon defect—with wnt8a mRNA (1 pg per embryo) overexpressed embryos or tcf7l1a MO (1.6 ng per embryo) knocked down embryos. Phenotype was observed at 72 hpf. The numbers below the morphology pictures mean number of embryos showing representative phenotype/total number of embryos. Scale bar, 500 μm. (B) Embryos injected with titrated LDs of nanog MO (160 pg), wnt8a mRNA (0.1 pg), or tcf7l1a MO (800 pg) showed no obvious defect, respectively, and co-injection of nanog MO with wnt8a mRNA or tcf7l1a MO at the same doses resulted in forebrain truncation (headless). N represents analyzed embryo number. (C) WISH analysis showing the expression of zygotic Wnt target genes; sp5l was up-regulated in nanog morphant, whereas Wnt antagonist dkk1b and frzb were reduced, and this expression defect can be restored by knockdown of wnt8a. Scale bar, 100 μm. (D) Statistical analysis of the embryos in panel C. N represents analyzed embryo number. (E) Relative mRNA levels of sp5l, dkk1b, and frzb in nanog morphants and rescued embryos examined by RT-qPCR. Error bars, mean ± SD, **P < 0.01, ***P < 0.001. (F) WISH analysis showing the forebrain defect in nanog morphant could be rescued by knockdown of wnt8a1 and wnt8a2. Scale bar, 100 μm. (G) Statistical analysis of the embryos in panel F. N represents analyzed embryo number. (H) Relative mRNA level of six3b and emx1 in nanog morphants and rescued embryos examined by RT-qPCR. Error bars, mean ± SD, **P < 0.01, ***P < 0.001. sp5l was detected at 75% epiboly, frzb and dkk1b were detected at 6 hpf, six3b and emx1 were detected at 2-somite stage, krox20 was used as stage control. (I) TOPflash analysis showing β-catenin transcriptional activity was up-regulated in both of LD and MD of nanog MO injected embryos at 4 hpf. Error bars, mean ± SD, **P < 0.01. (J) TOPflash assay showing co-transfection of Nanog inhibited the up-regulated β-catenin transcriptional activity induced by β-catenin in a dose-dependent manner in HEK293T cells. Error bars, mean ± SD, *P < 0.05, **P < 0.01. (K) TOPflash analysis showing co-transfection of Nanog inhibited the up-regulated β-catenin transcriptional activity induced by ΔN-β-catenin (a constitutively activated type of β-catenin) in HEK293T cells. Error bars, mean ± SD, **P < 0.01. The P values in this figure were calculated by Student t test. The underlying data in this figure can be found in S1 Data. HEK293T cells, human embryonic kidney 293T cells; hpf, hours post fertilization; LD, low dose; MD, moderate dose; MO, morpholino; RT-qPCR, reverse-transcription quantitative PCR; WISH, whole-mount in situ hybridization; WT, wild type.
|