|
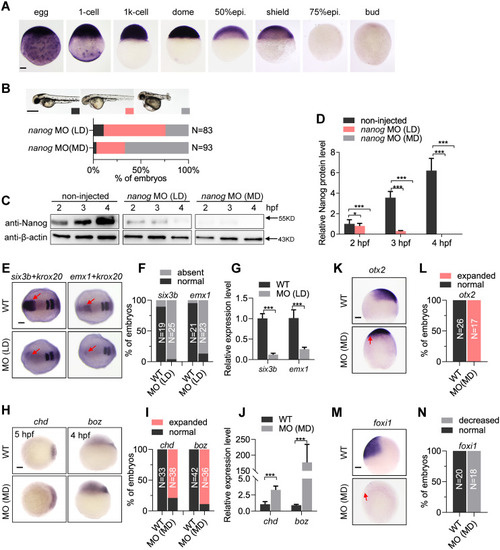
Knockdown of <italic>nanog</italic> leads to dorsalization and posteriorization.(A) WISH analysis showing nanog mRNA is maternally transcribed and vanishes at 75% epiboly stage. Scale bar, 100 μm. (B) Two different phenotypes are observed at 2 doses (0.5 ng/embryo, LD; 1.2 ng/embryo, MD) of nanog MO injected embryos, forebrain defect and dorsalization. Phenotype was observed at 36 hpf. N represents analyzed embryo number. Scale bar, 500 μm. (C) Western blot detection of Nanog in LD and MD nanog MO injected embryos. Nanog translation was blocked in all detected stages in the MD nanog MO injected embryos, and a low amount of Nanog protein can be detected at early stage in the LD nanog MO injected embryos. (D) Relative Nanog signal intensities in the western blot experiment (panel C). (E) WISH analysis showing expression of forebrain marker six3b and telencephalon marker emx1 were absent in LD MO injected embryos. krox20 was used as a stage-control marker. Red arrows indicate the expression region of six3b or emx1. Scale bar, 100 μm. (F) Statistical analysis of the embryos in panel E. N represents analyzed embryo number. (G) RT-qPCR analysis of six3b and emx1 in nanog morphants and WT embryos. Error bars, mean ± SD, ***P < 0.001. (H) WISH analysis showing 2 maternal β-catenin targets, boz and chd, were up-regulated in MD MO injected embryos. Scale bar, 100 μm. (I) Statistical analysis of the embryos in panel H. N represents analyzed embryo number. (J) RT-qPCR analysis of chd and boz in nanog morphants and WT embryos. Error bars, mean ± SD, ***P < 0.001. (K) WISH analysis showing expression of dorsal neuroectoderm marker otx2 was expanded in LD nanog MO injected embryos. Red arrow indicates the ventral expansion of otx2 signals. Scale bar, 100 μm. (L) Statistical analysis of the embryos in panel K. N represents analyzed embryo number. (M) WISH analysis showing the expression of ventral epidermal ectoderm marker foxi1 was eliminated in LD nanog MO injected embryos. Red arrow indicates the ventral absence of foxi1 signals. Scale bar, 100 μm. (N) Statistical analysis of the embryos in panel M. N represents analyzed embryo number. foxi1 and otx2 were detected at 90% epiboly stage, six3b and emx1 were detected at 2-somite stage, chd was detected at 5 hpf, and boz was detected at 4 hpf. The P values in this figure were calculated by Student t test. The underlying data in this figure can be found in S1 Data. hpf, hours post fertilization; LD, low dose; MD, moderate dose; MO, morpholino; RT-qPCR, reverse-transcription quantitative PCR; WISH, whole-mount in situ hybridization; WT, wild type.
|