
Fig. 6
- ID
- ZDB-FIG-200617-7
- Publication
- Navajas Acedo et al., 2019 - PCP and Wnt pathway components act in parallel during zebrafish mechanosensory hair cell orientation
- Other Figures
- All Figure Page
- Back to All Figure Page
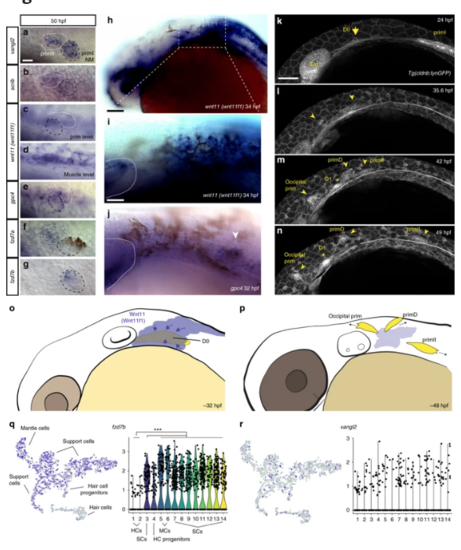
Temporal dynamic expression of the PCP and Wnt pathway genes during formation and migration of primII. a–g In situ localization on 50 hpf wild-type fish of mRNA for vangl2 (a), scrib (b), and wnt11 (wnt11f1) (c), at the level of the primordium; (d), at the level of the underlying muscle), gpc4 (e), fzd7a (f), fzd7b (g). The first neuromast derived from primI is outlined using black, while primII is outlined in white in (a–g). h In situ localization of wnt11 (wnt11f1) mRNA in a 34 hpf wild-type embryo. i Magnification of the expression in the area posterior to the ear in (h). The ear is delimited by a dashed line. j In situ localization of gpc4 mRNA in the area posterior to the ear at 32 hpf. Arrowhead indicates the putative localization of the D0 placode. k–n Still frames of the time lapse analysis of the formation of primII, primD, occipital prim, and D1 labeled in a Tg(cldnb:lynGFP) transgenic wild-type fish (Supplementary Video 5). Arrow in k indicates the original group of cells that gives rise to all three primordia. Arrowheads in l–n indicate the different primordia formed. Asterisk in m, n indicates the position of the D1 neuromast. o, p Schematic cartoon of the proposed mechanism by which Wnt11 (Wnt11f1) signals to cells in the D0 placode (o) to establish support cell organization (p). q t-SNE plots and violin plots showing expression of fzd7b (q) and vangl2 (r) in a 5 dpf neuromast during homeostasis. The Wilcox p-value for q = 8.45 × 10⁻³² in support cells and mantle cells versus hair cells, while in r the expression pattern was too sparse to generate meaningful statistics. HCs hair cells, SCs support cells, MCs mantle cells. *** denotes statistical significance. Scale bar in a equals 10 μm, h equals 50 μm, i equals 25 μm, k equals 50 μm |
| Genes: | |
|---|---|
| Fish: | |
| Anatomical Terms: | |
| Stage Range: | Prim-15 to Long-pec |