
Fig. 2-S1
- ID
- ZDB-FIG-200327-8
- Publication
- Ye et al., 2019 - High fat diet induces microbiota-dependent silencing of enteroendocrine cells
- Other Figures
- All Figure Page
- Back to All Figure Page
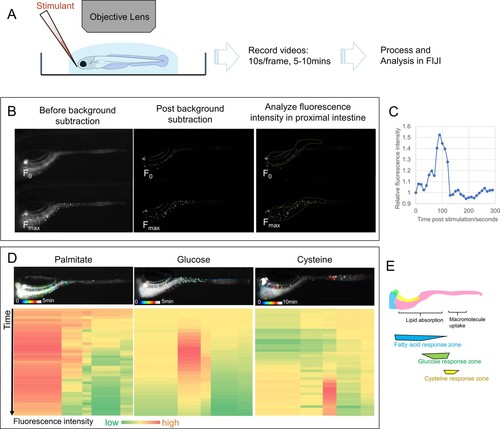
EEC activity assay.( A) Experimental design of EEC activity assay using Tg( neurod1:Gcamp6f) zebrafish. ( B) Representative images of EEC calcium fluorescence analysis using FIJI template matching and background subtraction in Tg( neurod1:Gcamp6f) zebrafish stimulated with palmitate. ( C) Relative fluorescence intensity in the proximal intestine in a series of video images from zebrafish in B. ( D) Spatial-temporal resolution of the EEC response to palmitate, glucose and cysteine stimulation. ( E) Representative images of the EEC nutrient response in a regional specific manner. Palmitate and glucose primarily activated EECs in the proximal intestine where most lipid and nutrient absorption occurs. In contrast, cysteine activated EECs in the mid-intestine (segment 2) where proteins and other macromolecules are digested andabsorbed by specialized intestinal epithelial cells in this region ( Nakamura et al., 2004; Wang et al., 2010; Park et al., 2019). |