
Fig. 8
- ID
- ZDB-FIG-200327-35
- Publication
- Ye et al., 2019 - High fat diet induces microbiota-dependent silencing of enteroendocrine cells
- Other Figures
- All Figure Page
- Back to All Figure Page
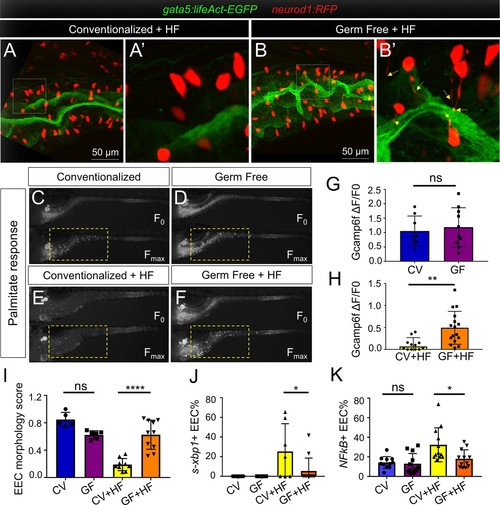
High fat feeding induced EEC silencing is microbiota dependent.( A–B) Confocal images of 6 dpf zebrafish intestines from conventionalized (CV) and germ free (GF) larvae following 10 hr of high fat (HF) feeding. EECs are marked with Tg(neurod1:RFP) and the apical lumen of intestine is marked with Tg(gata5:lifeAct-EGFP). ( A’–B’) Zoom view of EECs from CV and GF zebrafish following HF feeding. Yellow arrows in B’ indicate EEC apical extensions in HF fed GF zebrafish. ( C–F) Representative images of the EEC calcium response toward palmitate stimulation in CV and GF Tg(neurod1:Gcamp6f)larvae with or without 6 hr of HF feeding. ( G–H) Quantification of the EEC calcium response to palmitate stimulation represented in C-F. ( I) Quantification of the EEC morphology score in CV and GF zebrafish larvae with or without 10 hr of HF feeding represented in A and B. ( J) Quantification of xpb1+ EECs (%) in CV and GF Tg(neurod1:RFP); Tg(ef1α:xbp1δ-GFP)zebrafish larvae with or without 6 hr HF feeding. ( K) Quantification of NF-κB+ EECs (%) in CV and GF Tg(neurod1:RFP); Tg(NFkB:EGFP) zebrafish larvae with or without 10 hr HF feeding. Student t-test was used in G,H and one-way ANOVA with post-hoc Tukey test was used in I-K for statistical analysis. *p<0.05, **p<0.01, ****p<0.0001. |