
Fig. 4-S1
- ID
- ZDB-FIG-200327-13
- Publication
- Ye et al., 2019 - High fat diet induces microbiota-dependent silencing of enteroendocrine cells
- Other Figures
- All Figure Page
- Back to All Figure Page
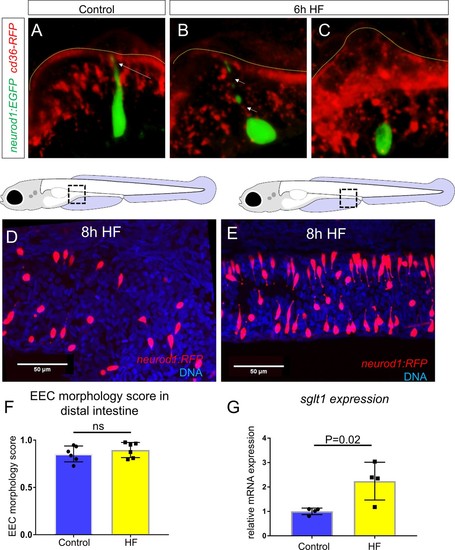
HF feeding does not alter EEC morphology in the distal intestine and HF feeding dose not impair sglt1 expression.( A) Confocal projection of a typical EEC in the proximal intestine of control TgBAC(neurod1:EGFP); TgBAC(cd36-RFP) zebrafish. The white arrow indicates the apical projection that extends to the intestinal lumen. ( B) Confocal image of an EEC in the proximal intestine 6 hr post high fat (HF) meal feeding in TgBAC(neurod1:EGFP); TgBAC(cd36-RFP) zebrafish. The white arrows indicate the discontinuous fragmentation of an apical projection that can only be observed in HF fed EECs. ( C) Confocal image of ‘closed’ EECs in the proximal intestine after 6 hr post HF meal feeding in TgBAC(neurod1:EGFP); TgBAC(cd36-RFP) zebrafish. ( F) Representative confocal projections of EECs in the proximal intestine following 8 hr of high fat feeding. ( G) Representative confocal projections of EECs in the distal intestine (segments 2 and 3) following 8 hr HF feeding. ( H) Quantification of EEC morphology in the distal-intestine in control and 8 hr HF fed zebrafish. ( I) Quantification of sglt1 expression from the digestive tracts of control and 6 hr HF fed zebrafish. Student t-test was used in H and I for statistical analysis. |