
FIGURE
Fig. 6-S2
- ID
- ZDB-FIG-200327-32
- Publication
- Ye et al., 2019 - High fat diet induces microbiota-dependent silencing of enteroendocrine cells
- Other Figures
- All Figure Page
- Back to All Figure Page
Fig. 6-S2
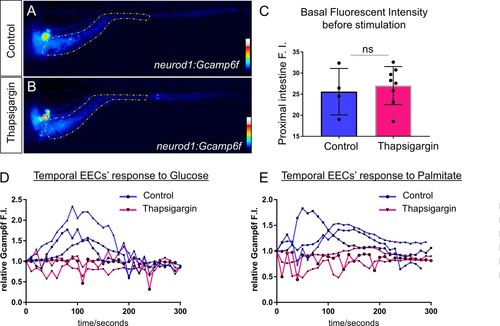
Treatment of Thapsigargin inhibited EEC response to nutrient stimulation.( A–B) Representative heatmap image of Tg(neurod1:Gcamp6f) zebrafish in control ( A) or 2 hr post Thapsigargin treated conditions. Yellow lines in A and B indicate the proximal intestine area that used to quantify the fluoresence intensity in C. ( C) Quantification of basal fluoresence in the proximal intestine in control and Thapsigargin treatment zebrafish. ( D) Representative EECs’ temporal response to glucose stimulation in control and 2 hr post Thapsigargin treated zebrafish. ( E) Representative EECs’ temporal response to palmitate stimulation in control and 2 hr post Thapsigargin treated zebrafish. |
Expression Data
Expression Detail
Antibody Labeling
Phenotype Data
Phenotype Detail
Acknowledgments
This image is the copyrighted work of the attributed author or publisher, and
ZFIN has permission only to display this image to its users.
Additional permissions should be obtained from the applicable author or publisher of the image.
Full text @ Elife