
Fig. 1-S2
- ID
- ZDB-FIG-200327-6
- Publication
- Ye et al., 2019 - High fat diet induces microbiota-dependent silencing of enteroendocrine cells
- Other Figures
- All Figure Page
- Back to All Figure Page
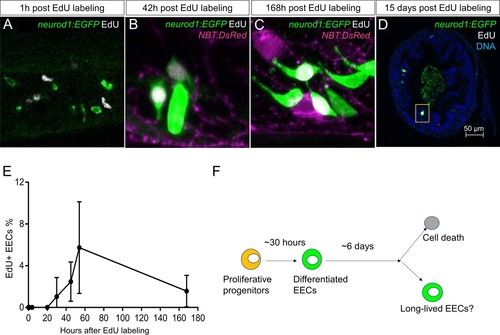
Analysis of EEC lifespan in zebrafish larvae using single dose EdU labeling.EdU was injected into the pericardiac sac region of 5 dpf TgBAC(neurod1:EGFP) zebrafish using previously described methods ( Ye et al., 2015). Zebrafish were fixed at 1 hr, 4 hr, 20 hr, 30 hr, 45 hr, 54 hr, 7 days (168 hr) and 15 days post EdU injection. ( A–D) Confocal images of EdU fluorescence staining in the TgBAC(neurod1:EGFP) zebrafish intestine. ( E) Quantification of the percentage of EdU+ EECs in zebrafish intestine following EdU tracing. t = 0 (n = 6), t = 1 hr (n = 8), t = 4 hr (n = 5), t = 20 hr (n = 6), t = 30 hr (n = 11), t = 45 hr (n = 9), t = 54 hr (n = 6), t = 168 hr (n=5). No EdU+ EECs could be detected until 30 hr post EdU injection and some EdU+ EECs remained 15 days post EdU injection. ( F) Schematic of our working model of EEC lifespan. |