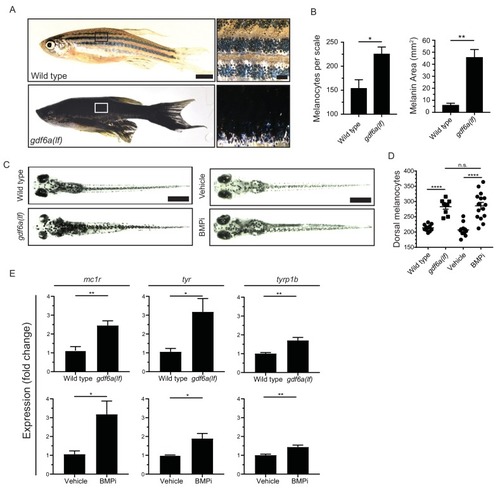
gdf6a loss or BMP inhibition causes the development of supernumerary melanocytes. (A) Images of wild-type and gdf6a(lf) adult zebrafish, scale bar = 4 mm, inset scale bar = 1 mm. (B) Quantification of number of melanocytes (left) and scale pigmentation using melanin coverage (right), n = 3 scales per group. (C) Wild-type and gdf6a(lf) embryos imaged at 5 days post fertilization (DPF); vehicle- and BMPi-treated embryos imaged at 5 DPF. Scale bar = 1 mm. Animals were treated with epinephrine prior to imaging. (D) Quantification of dorsal melanocytes per animal in 5 DPF wild-type, gdf6a(lf) mutant, vehicle-, and BMPi-treated embryos. n = 11, 9, 11, and 15 embryos, respectively, from two independent experiments (N = 2). (E) Expression of melanocyte differentiation markers mc1r, tyr, and tyrp1b by qRT-PCR in wild-type, gdf6a(lf) mutant, vehicle-, and BMPi-treated embryos. n = 5–6 replicates across two independent experiments (N = 2) for each group. Expression was normalized to β-actin. Error bars represent mean + /- SEM. P-values were calculated using Student’s t-test in panel B and E, and one-way ANOVA with Tukey’s multiple comparisons test in panels D, *p<0.05, **p<0.01, ***p<0.001, ****p<0.0001, n.s., not significant.
|
