
Figure 2—figure supplement 1.
- ID
- ZDB-FIG-200124-27
- Publication
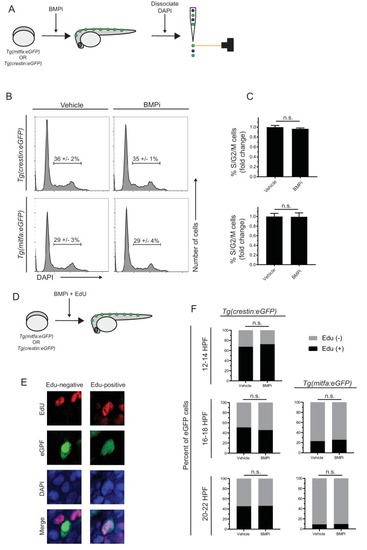
- Gramann et al., 2019 - Regulation of zebrafish melanocyte development by ligand-dependent BMP signaling
- Other Figures
- All Figure Page
- Back to All Figure Page
( |