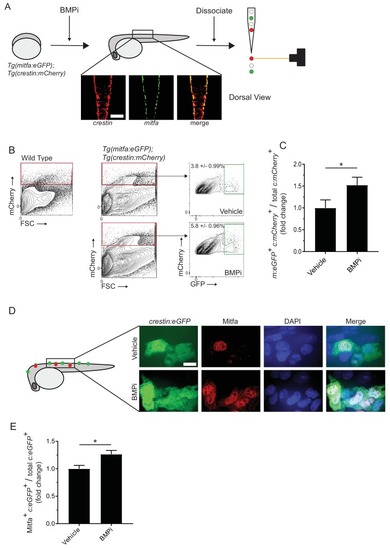
Inhibition of BMP signaling increases mitfa-positive neural crest cells. (A) Diagram of experiment. Tg(crestin:mCherry); Tg(mitfa:eGFP) embryos were treated with BMPi from 12 to 24 HPF. At 24 HPF, embryos were dissociated and analyzed via flow cytometry for GFP- and mCherry-positive cells, scale bar = 200 µm. (B) Gating strategy based on non-transgenic wild-type control to identify crestin:mCherry-positive cells and crestin:mCherry/mitfa:eGFP double-positive cells. Top, control vehicle-treated embryos. Bottom, BMPi-treated embryos. (C) Fold change in crestin:mCherry/mitfa:eGFP double-positive cells per total crestin:mCherry-positive cells in vehicle and BMPi-treated groups, N = 3 biological replicates of 80–100 stage-matched embryos pooled for each condition. m:eGFP, mitfa:eGFP; c:mCherry, crestin:mCherry. (D) anti-Mitfa immunofluorescence in Tg(crestin:eGFP) embryos treated with BMPi or vehicle control and fixed at 24 hr, scaled bar = 10 µm. (E) Fold change in Mitfa/crestin:eGFP double-positive cells per total crestin:eGFP-cells, n = 16 embryos from two independent experiments (N = 2) for each condition. c:eGFP, crestin:eGFP. Error bars represent mean + /- SEM; P-value was calculated using ratio-paired t-test in panel C and Student’s t-test in panel E, *p<0.05
|
