
Figure 7
- ID
- ZDB-FIG-191230-909
- Publication
- Baron et al., 2019 - Cell Type Purification by Single-Cell Transcriptome-Trained Sorting
- Other Figures
- All Figure Page
- Back to All Figure Page
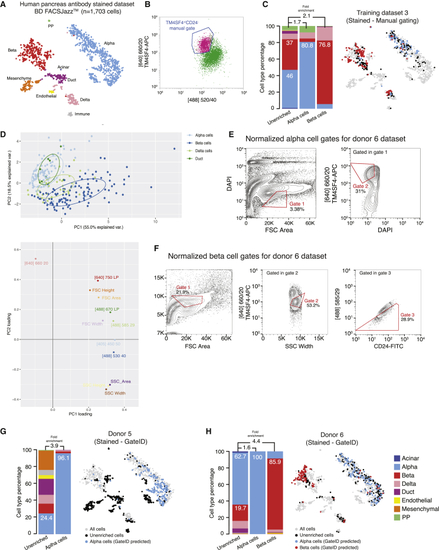
Gates for Enrichments of α and β Cells from Antibody-Stained Pancreatic Tissue on BD FACSJazz (A) t-SNE map of the human pancreas antibody-stained dataset (TD3, donors 5 and 6). Single cells are colored based on cell type. (B) FACS plot of TD3, showing the manual sorting gate for α cells. Displayed cells are live singlets. (C) Barplot and t-SNE map showing the outcome of manual gating enrichments for TD3 on BD FACSJazz. (D) Upper panel: PCA of TD3 (antibody-stained, BD FACSJazz). Each point represents a single cell, and single cells are colored based on cell type identification from scRNA-seq. The ellipses represent normal contour lines that contain 50% of the data points for each cell type. Bottom panel: PC1 and PC2 loadings. Each point represents a FACS channel measured by the BD FACSJazz. (E and F) Contour plots of antibody-stained human pancreas cells showing experimental sorting gates for (E) α cells and (F) β cells for donor 6 (representative example for donor 5 and 6 α cell enrichment experiments) on BD FACSJazz. Sorted cells passed through normalized gate 1 and gate 2. Percentages of events within each gate are indicated. (G and H) Barplots and t-SNE maps showing the outcome of GateID enrichments for (G) donor 5 and (H) donor 6 on BD FACSJazz. See also |
Reprinted from Cell, 179, Baron, C.S., Barve, A., Muraro, M.J., van der Linden, R., Dharmadhikari, G., Lyubimova, A., de Koning, E.J.P., van Oudenaarden, A., Cell Type Purification by Single-Cell Transcriptome-Trained Sorting, 527-542.e19, Copyright (2019) with permission from Elsevier. Full text @ Cell