
Figure S2
- ID
- ZDB-FIG-191230-897
- Publication
- Baron et al., 2019 - Cell Type Purification by Single-Cell Transcriptome-Trained Sorting
- Other Figures
- All Figure Page
- Back to All Figure Page
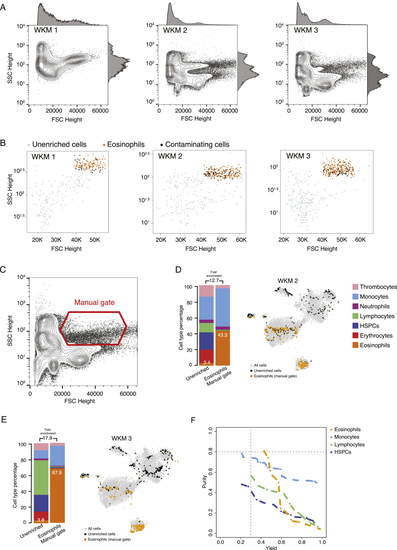
Eosinophil Enrichments with Unstained WKM Cells on BD FACSJazz, Related to (A) FSC Height and SSC Height contour plots of all WKM cells analyzed for eosinophils enrichment experiments WKM 1 to 3. Histograms on each plot show population density is FSC and SSC Height channels. (B) Plots showing sorted unenriched and GateID enriched cells for eosinophil experiments WKM 1 to 3 in FSC and SSC Height. Grey points are cells from the unenriched library and colored points are cells from the GateID enriched library. Sorted eosinophils in the GateID enriched library are highlighted in orange and sorted non-eosinophil contaminating cells in the GateID enriched library are represented in black. (C) FSC Height and SSC Height contour plot of all WKM cells for WKM 2. The eosinophil manual gate used in WKM 2 experiment is represented in red (representative for WKM 2 and 3 manual enrichment experiments). (D and E) Barplots and t-SNE maps showing the outcome of eosinophil enrichments using manual gating for two independent experiments: (D) WKM 2 and (E) WKM 3 on BD FACSJazz. In the barplots, numbers in the bars indicate the percentage of eosinophils in the corresponding library and numbers above the bars indicate the cell type fold enrichment between unenriched and manually enriched library. On the t-SNE maps, gray points represent all cells from the WKM dataset. For each experiment, black dots are single cells in the unenriched library for a given experiment, while colored dots are single cells in the manually enriched library for the same experiment. (F) Curves showing trade-off between yield and purity of GateID solutions for eosinophils, monocytes, lymphocytes and HSPCS for the unstained TD1. All gates for a given cell type with lower purity or yield are internal to these curves and are not shown. Dashed lines represent our thresholds for acceptable yield (0.3) and purity (0.8). |
Reprinted from Cell, 179, Baron, C.S., Barve, A., Muraro, M.J., van der Linden, R., Dharmadhikari, G., Lyubimova, A., de Koning, E.J.P., van Oudenaarden, A., Cell Type Purification by Single-Cell Transcriptome-Trained Sorting, 527-542.e19, Copyright (2019) with permission from Elsevier. Full text @ Cell