
Figure 5
- ID
- ZDB-FIG-191230-903
- Publication
- Baron et al., 2019 - Cell Type Purification by Single-Cell Transcriptome-Trained Sorting
- Other Figures
- All Figure Page
- Back to All Figure Page
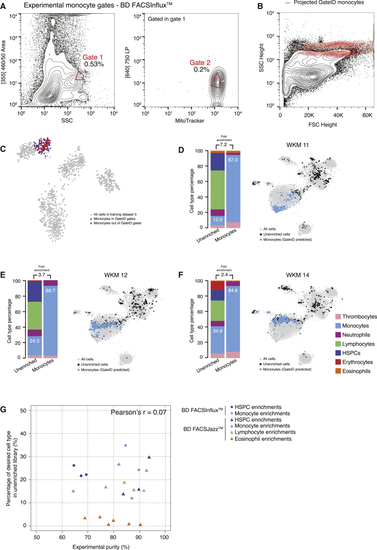
GateID Allows Purification of Zebrafish Monocytes (A) Contour plots of stained WKM cells, showing experimental sorting gates for monocytes for the WKM 11 experiment (representative example for WKM 11, 12, and 14 monocyte enrichment experiments) on BD FACSInflux. Sorted cells passed through gate 1 and gate 2. Percentages of events within each gate are indicated. (B) Projection of the sorted GateID monocytes for WKM 11 in FSC height versus SSC height (representative example for WKM 11, 12, and 14 monocyte enrichment experiments). (C) t-SNE map of zebrafish WKM TD3, where monocytes inside and outside of GateID gates are colored red and blue, respectively. (D–F) Barplots and t-SNE maps showing the outcome of monocyte enrichments for (D) WKM 11, (E) WKM 12, and (F) WKM 14 on BD FACSInflux. (G) Scatterplot showing the percentage of the desired cell type in the unenriched library versus the achieved GateID purity in the enriched library for all WKM enrichment experiments. Points are colored based on the cell type enriched (orange for eosinophils, dark blue for HSPCs, light blue for monocytes, and green for lymphocytes) and shaped based on the FACS machine used for isolation (triangles for BD FACSJazz and circles for BD FACSInflux). See also |
Reprinted from Cell, 179, Baron, C.S., Barve, A., Muraro, M.J., van der Linden, R., Dharmadhikari, G., Lyubimova, A., de Koning, E.J.P., van Oudenaarden, A., Cell Type Purification by Single-Cell Transcriptome-Trained Sorting, 527-542.e19, Copyright (2019) with permission from Elsevier. Full text @ Cell