
|
Figure 7
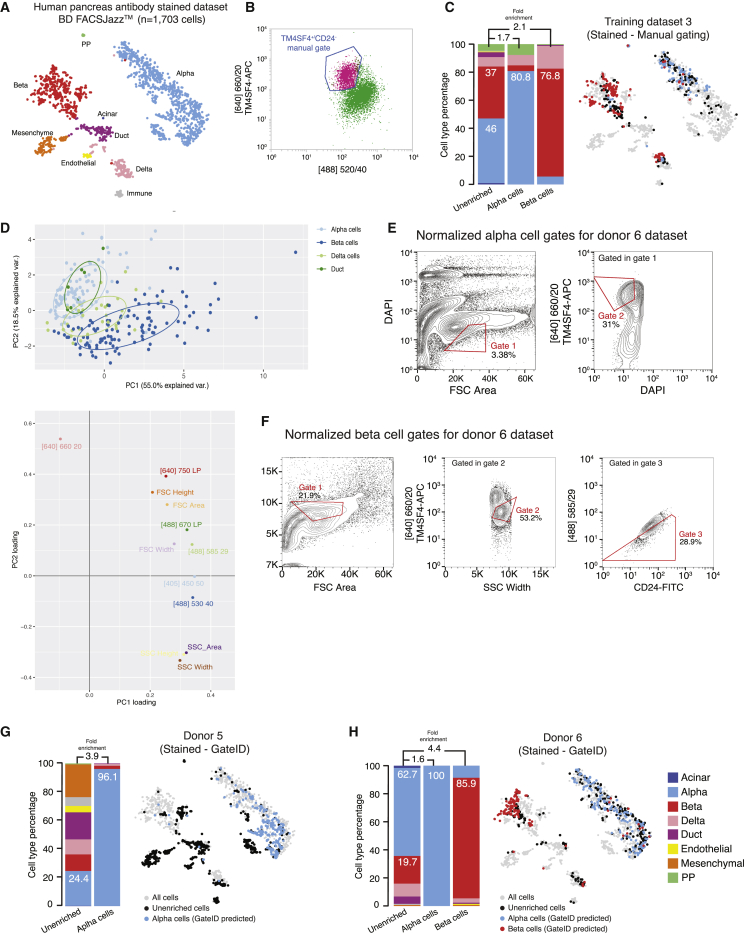
Gates for Enrichments of α and β Cells from Antibody-Stained Pancreatic Tissue on BD FACSJazz
(A) t-SNE map of the human pancreas antibody-stained dataset (TD3, donors 5 and 6). Single cells are colored based on cell type.
(B) FACS plot of TD3, showing the manual sorting gate for α cells. Displayed cells are live singlets.
(C) Barplot and t-SNE map showing the outcome of manual gating enrichments for TD3 on BD FACSJazz.
(D) Upper panel: PCA of TD3 (antibody-stained, BD FACSJazz). Each point represents a single cell, and single cells are colored based on cell type identification from scRNA-seq. The ellipses represent normal contour lines that contain 50% of the data points for each cell type. Bottom panel: PC1 and PC2 loadings. Each point represents a FACS channel measured by the BD FACSJazz.
(E and F) Contour plots of antibody-stained human pancreas cells showing experimental sorting gates for (E) α cells and (F) β cells for donor 6 (representative example for donor 5 and 6 α cell enrichment experiments) on BD FACSJazz. Sorted cells passed through normalized gate 1 and gate 2. Percentages of events within each gate are indicated.
(G and H) Barplots and t-SNE maps showing the outcome of GateID enrichments for (G) donor 5 and (H) donor 6 on BD FACSJazz.
See also
Reprinted from Cell, 179, Baron, C.S., Barve, A., Muraro, M.J., van der Linden, R., Dharmadhikari, G., Lyubimova, A., de Koning, E.J.P., van Oudenaarden, A., Cell Type Purification by Single-Cell Transcriptome-Trained Sorting, 527-542.e19, Copyright (2019) with permission from Elsevier. Full text @ Cell